This is an edited version of Scott’s recent testimony before the Work & Welfare Subcommittee of the House Ways & Means Committee.
In early 1995, the forerunner to this subcommittee began drafting legislation that would lead, 18 months later, to the enactment of the Personal Responsibility and Work Opportunity Reconciliation Act (PRWORA). As a 23-year-old community organizer fresh out of college, I was convinced the law would prove disastrous. But by the time I entered graduate school four years later, that position was already difficult to maintain for anyone who looked at the data.
Today, I believe welfare reform benefited poor families enormously. It eliminated a program that, while well-intentioned, trapped people in circumstances that all but precluded upward mobility. It led to a remarkable decline in the number of families dependent on cash welfare. It connected millions to the world of work, turned the tide on several decades’ worth of deteriorating family stability, and reduced child poverty.
Welfare reform provided a model for the antipoverty policy reforms included in the recent One Big Beautiful Bill Act. But denial of its success remains strong, especially as the 20th century fades into history. The past decade has seen ever-louder calls for no-strings-attached cash benefits in the form of a child allowance or universal basic income. Such policies would bring back features of the pre-1990s safety net that impeded upward mobility. Thirty years on, welfare reform requires defending. Skeptics must be reminded of—or introduced to—the evidence of its success and the risks of rolling back its essential features.
Ending Welfare as We Knew It
By the time PRWORA was enacted, momentum for welfare reform had been building for years. Policymakers and the public increasingly objected to a safety net they believed discouraged work, stable families, and family independence. The primary welfare program, Aid to Families with Dependent Children (AFDC), provided cash benefits with few strings attached. Moreover, it steadily scaled back those benefits when family income rose, as when a parent took a job, got a raise, increased their work hours, or got married.
This combination proved disastrous over the years, promoting the growth of an underclass of single parent families dependent on government benefits. AFDC was a truly perverse safety-net-turned-poverty-trap. It impeded upward mobility by discouraging not only work and marriage, but saving, human capital investment, deferred gratification, and ultimately higher aspiration. It compounded the geographic concentration of single parenthood, joblessness, crime, and educational disadvantage that created generational poverty for the children formed and shaped in such environments. It made the broader American public resentful of poor people generally, leading them to view families on welfare as undeserving of the aid they received.
A system so counterproductive and so at odds with the social contract was overdue for reform, and 1988’s Family Support Act left too much in place. In early 1992, President George H. W. Bush encouraged state submission of waiver requests to modify features of AFDC. His successor, President Bill Clinton, who had entered office in 1993 promising to “end welfare as we know it,” continued to encourage and facilitate this experimentation. In his 1994 State of the Union address, he reiterated his intention to overhaul the system. The Clinton welfare reform proposal was unveiled months later.
The pace of reform efforts accelerated after Republicans won control of both houses of Congress in that year’s elections, and PRWORA was signed into law August 22, 1996. The law ended the federal entitlement to cash welfare benefits for nondisabled families and replaced AFDC with the block-granted Temporary Assistance for Needy Families program (TANF). It mandated five-year lifetime limits on receipt of federal benefits for most families, and it required states to institute work requirements while otherwise giving them broad latitude to spend TANF dollars on benefits and services as they saw fit. PRWORA also expanded federal support for childcare assistance, beefed up the national child support enforcement system, instituted modest work requirements in the food stamp program, and restricted eligibility for safety net benefits among some immigrants.
The Success of Welfare Reform
Welfare reform has proven a remarkable and unambiguous success. Start with dependence on government assistance. In 1994, about 46 percent of single parent families received AFDC benefits.1 One in every seven American children (14 percent) were in AFDC families.2 By 2024, just 8 percent of single parent families received TANF benefits, and fewer than 3 percent of children were in TANF families. These declines were especially dramatic between 1994 and 2000, with both figures falling by more than 50 percent over these six years.
Welfare Receipt Declined Dramatically after Reform
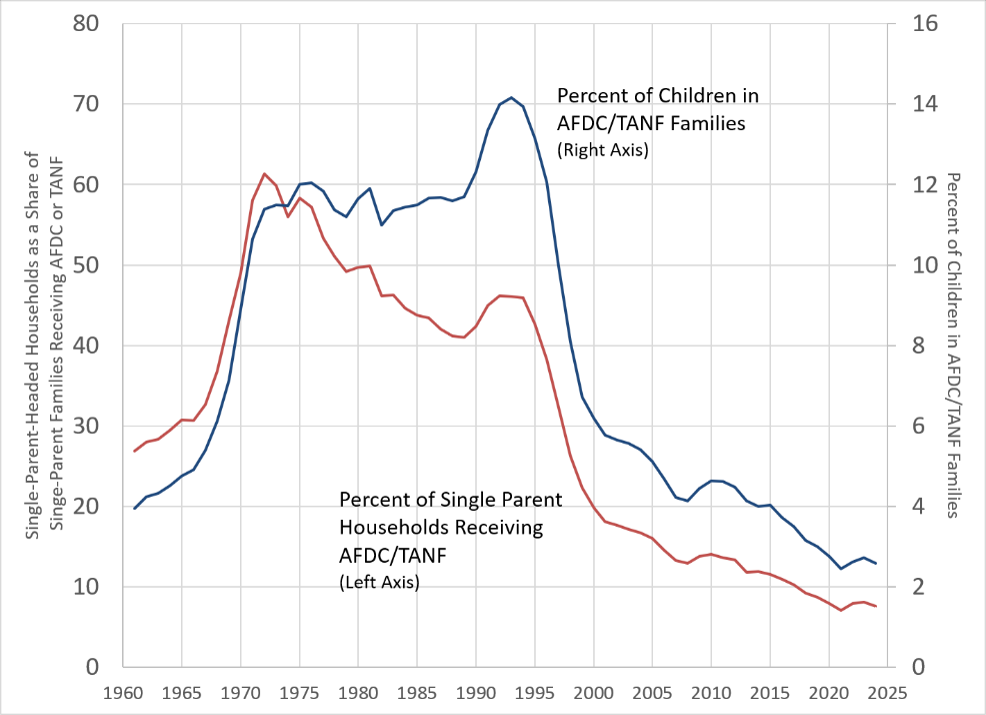
It’s true that the declines started before 1996, but so did welfare reform. By the time PRWORA became law, over half the states were experimenting with time limits, work requirements, and other reforms through major federal waivers. The prominence of welfare reform on the federal policy agenda in both 1994 and 1995, to say nothing of the rhetoric of the 1992 presidential campaign, also may have affected AFDC enrollment as the US came out of recession.
Critics of welfare reform in 1996—this author included—predicted that welfare reform would not go well. Many observers worried that the economy would not be able to provide jobs for the millions who would lose their welfare benefits because of the time limits and work requirements. They believed that the barriers to work among many parents on welfare –low education levels, childcare needs—precluded them from finding or keeping a job.
What actually happened was that many people who would have received welfare benefits before PRWORA instead earned a paycheck. The employment rate among single mothers rose from 59 percent in 1994 to 72 percent in 2000—an unprecedented increase in such a short period.3 Between 1997 and 2000 alone, the rate rose by more than 7 points. The jump was especially marked among never-married single mothers. During the three years from 1996 to 1999, their employment rate sky-rocketed from 50 percent to 65 percent. There were no corresponding increases among married mothers or single childless women.
Employment among Single Mothers Jumped after Welfare Reform and Stayed Elevated
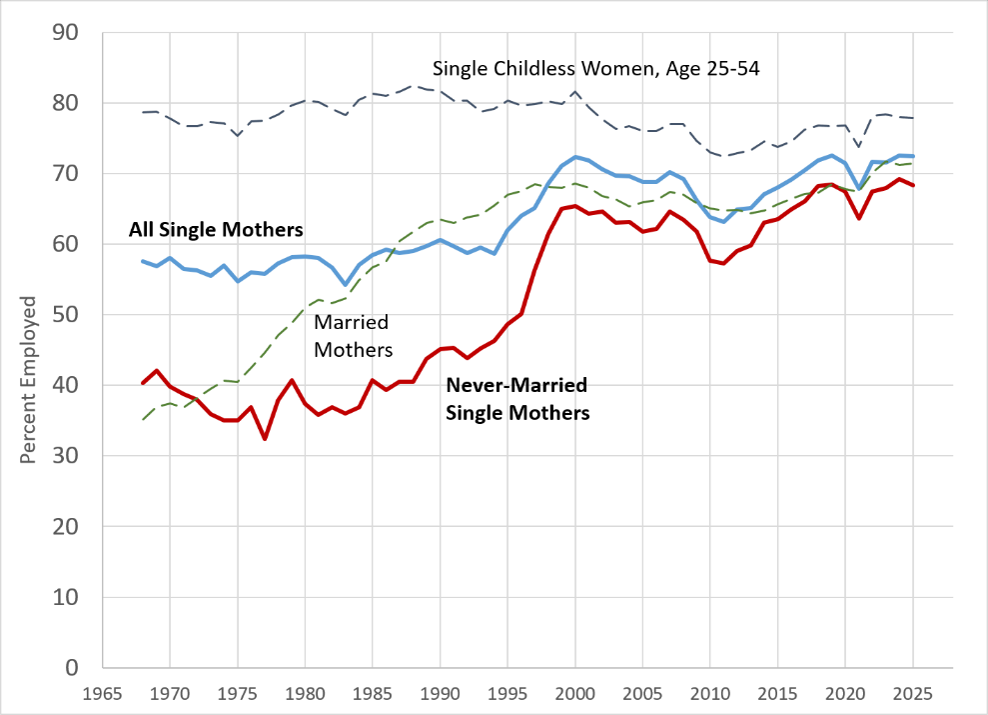
Many critics of welfare reform argued that it was just the strong economic growth of the mid- to late 1990s that had increased the employment of single mothers. This argument has seemed less plausible the further we have traveled from Y2K. The 1990s boom was important, but there was no precedent in past expansions for the jump in employment immediately after welfare reform. Moreover, employment rates among single mothers did not simply rise during the 1990s; they never returned to pre-PRWORA levels. Even in the depths of the Great Recession, single mothers were more likely to be employed than they had ever been before 1995. Today, the employment rate of never-married single mothers is 18 percentage points higher than in 1995. If their employment rate had remained at 1995 levels, 1.1 million fewer never-married single mothers would be employed today.
Studies have attempted to untangle the relative importance of welfare reform, economic growth, and the 1993 expansion of the Earned income tax credit (EITC) in reducing caseloads and raising the employment rates of single mothers during the 1990s and early 2000s.4 One paper reported that the EITC expansion was more important than the improved job market and welfare reform in explaining the increase in single mother employment from 1993 to 1999. 5 But welfare reforms and the declining value of welfare benefits explained 2.8 points of the paper’s 13.9-percentage-point increase over the period. These factors together were more important than the net effect of falling unemployment and the declining value of the minimum wage.
Another study found that the EITC expansion and falling unemployment were more important than welfare reform in explaining the 11.3-percentage-point increase from 1993-2002 in employment among single mothers.6 But it estimated that work requirements and time limits alone increased employment by 3.1 percentage points over these nine years. To put this into perspective, employment among single mothers rose by 1.9 percentage points over the 25 years from 1968 to 1993 and 1.9 points over the 23 years from 2002 to 2025.
These studies were confined to the 1990s boom and surrounding years. The fact that single mother employment rates remained high during the Great Recession suggests that the importance of the economy was overstated in this research literature. The 1990s expansion was the first since at least 1960 in which poverty responded to the falling unemployment rate as much among single mother families as it did among married parents.7 Moreover, poverty and food problems fell more among single mothers than married parents in the years following PRWORA’s enactment.
What’s more, the effect of the EITC on employment has, in recent years, been called into question. Two studies conclude that welfare reform was more important than the EITC expansion during the 1990s. 8 Perhaps the research will someday be more conclusive than it is today, but regardless, it seems clear that welfare reform sizably increased employment among single mothers.
Welfare reform was intended not just to reduce dependence and increase work; policymakers hoped it would also reverse troubling increases in out-of-wedlock childbearing and the share of children being raised by a single parent. Several aspects of PRWORA could have had such impacts. By making it more difficult to receive no-strings-attached assistance, welfare reform made single parenthood less viable. Moreover, the law included the “minor parent provision,” requiring minors to be in school or training and to live with an adult in order to receive benefits. It also allowed states to establish “family caps”—limits to the number of children eligible for welfare assistance. At one point, nearly half of states had adopted family caps, though few do today.9
The case that welfare reform affected marriage and fertility outcomes is more circumstantial than the evidence of its impact on employment. The research literature comes to mixed conclusions.10 A challenge for such studies is isolating the impact of welfare (AFDC or TANF) and of changes to welfare policy when so many other safety net programs encourage single parenthood.
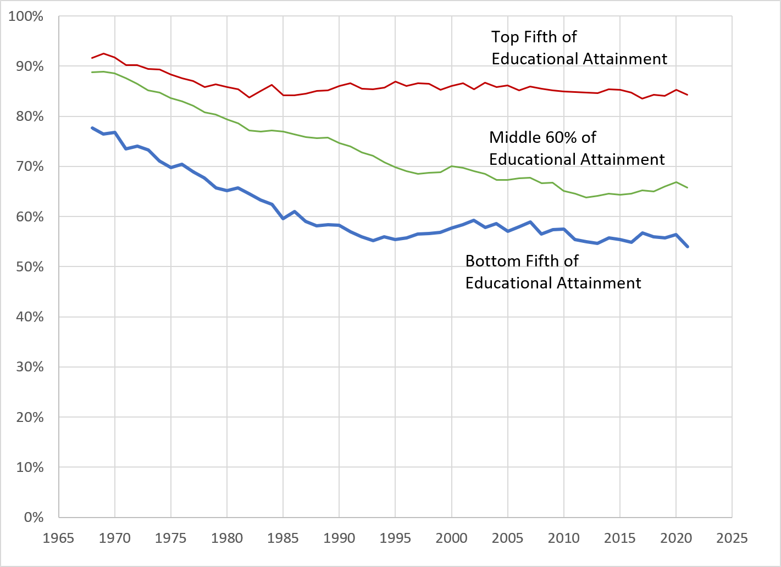
Nevertheless, several lines of historical evidence support the contention that welfare reform made an impact. First, the two-parent household stopped getting rarer for the most disadvantaged children. Among children whose parents had the lowest educational attainment, the share living with married parents fell steadily from 1968 to 1993, from 78 percent to 55 percent. It then rose by about 4 percentage points from 1995 to 2002 before declining modestly. As of 2021, the share was one point lower than in 1993, though it had been one point higher from 2018 to 2020. 11
Notably, the share of children with middle-educated parents who lived with both continued to fall. And if cohabiting, but unmarried parents are counted, living with two parents was more common in 2021 than in 1984 among children with less educated parents.
The Decline in Children Living with Two Married Parents Stopped after Welfare Reform
We might not expect a policy change to greatly affect the share of children living with married parents in the short run—it’s unrealistic to expect many non-intact families, particularly with older children, simply to reunite when the incentives change. This indicator is more of a “stock”—reflecting past marital and fertility decisions—than a “flow” (potentially immediately responsive to policy changes). We would expect to see more immediate change in the flows of out-of-wedlock pregnancy and birth rates.
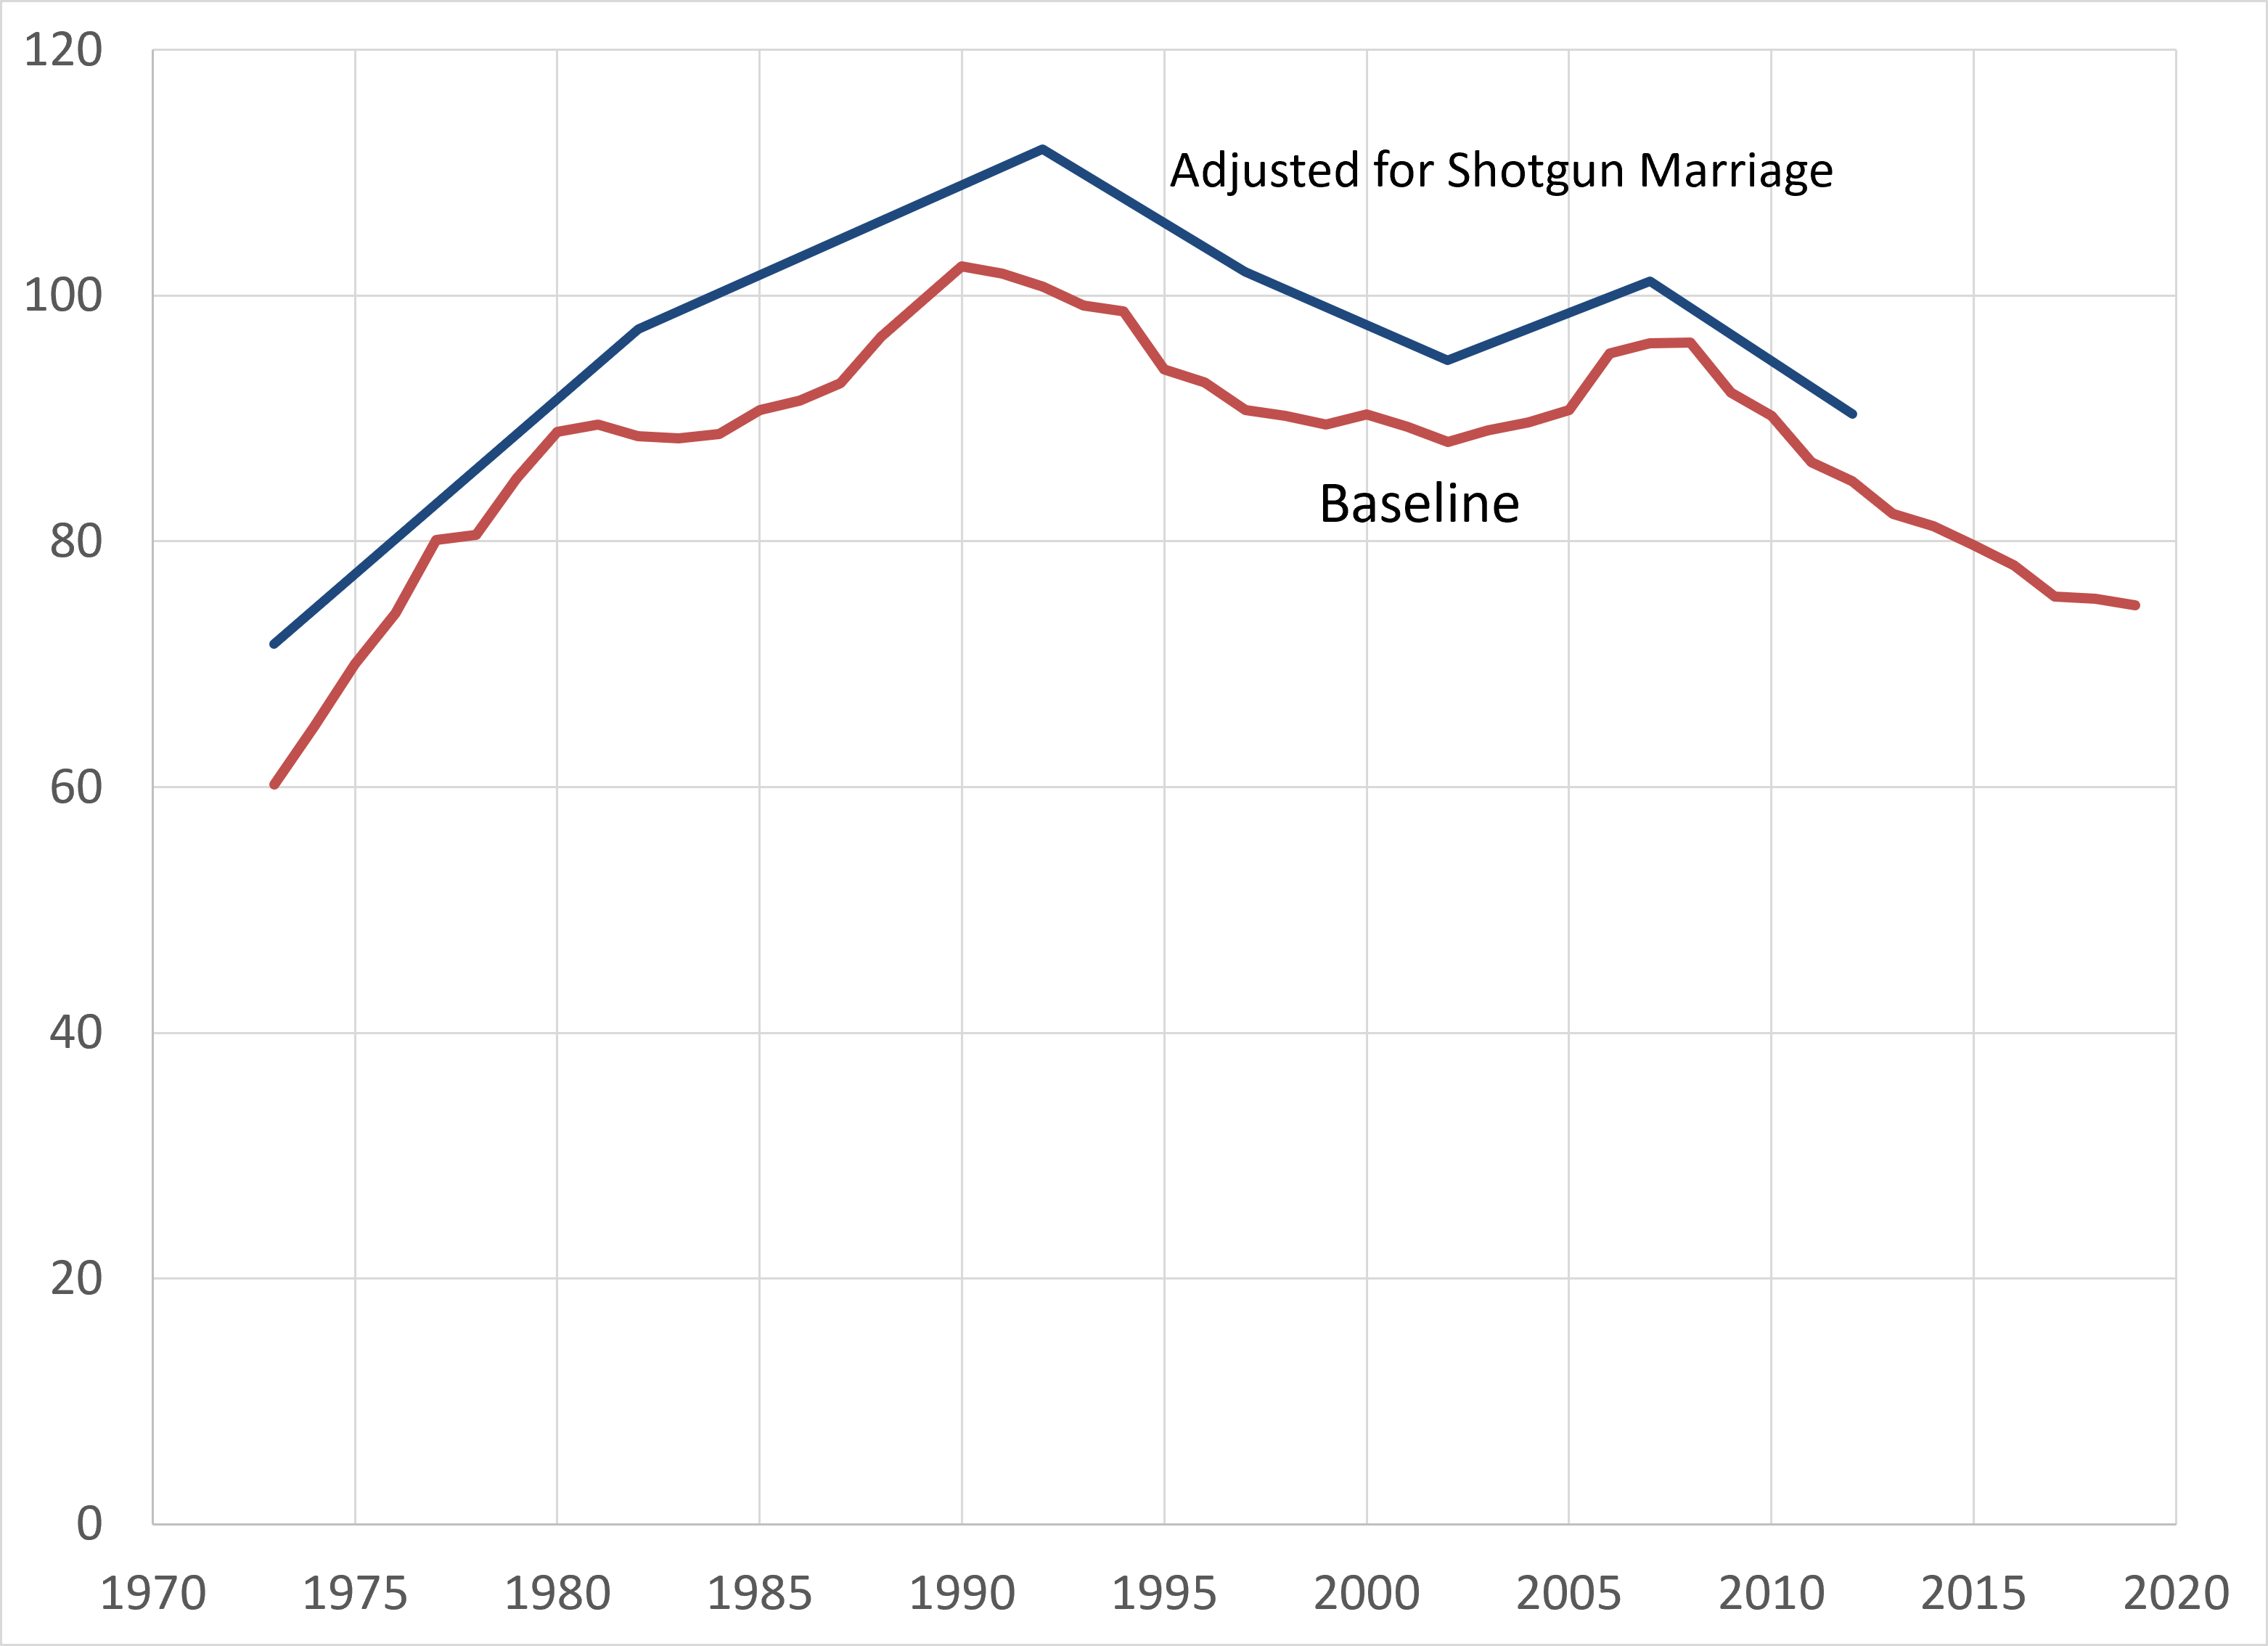
In fact, the nonmarital pregnancy rate peaked in 1990 and declined by about 30 percent by 2019. 12 In that year, nonmarital pregnancies were less common than in 1977.
Pregnancies among Unmarried Women Became Rarer
In addition, out-of-wedlock birthrates stopped rising after 50 years of steady increases. The rate has recently been falling. From 1940 to 1991, the nonmarital birth rate (out-of-wedlock births per 1,000 unmarried women) rose steadily. It then declined from 1991 to 1997, was flat for a few years, rose to a new peak between 2002 and 2007, and has fallen steadily since 2008. 13 Robert Rector has determined that the brief increase in the nonmarital birth rate from 2002 to 2007 reflects (1) out-of-wedlock births to older women who had delayed births that would have occurred in the 1990s and (2) births to cohabiting couples.14 Such circumstances are rarely an auspicious start for a child, but probably less of a disadvantage than being born to a young single mother without a partner present. Regardless, the nonmarital birth rate is lower today than at any time since 1987.
A 50-Year Rise in Births to Unmarried Women Stopped and (Eventually) Reversed
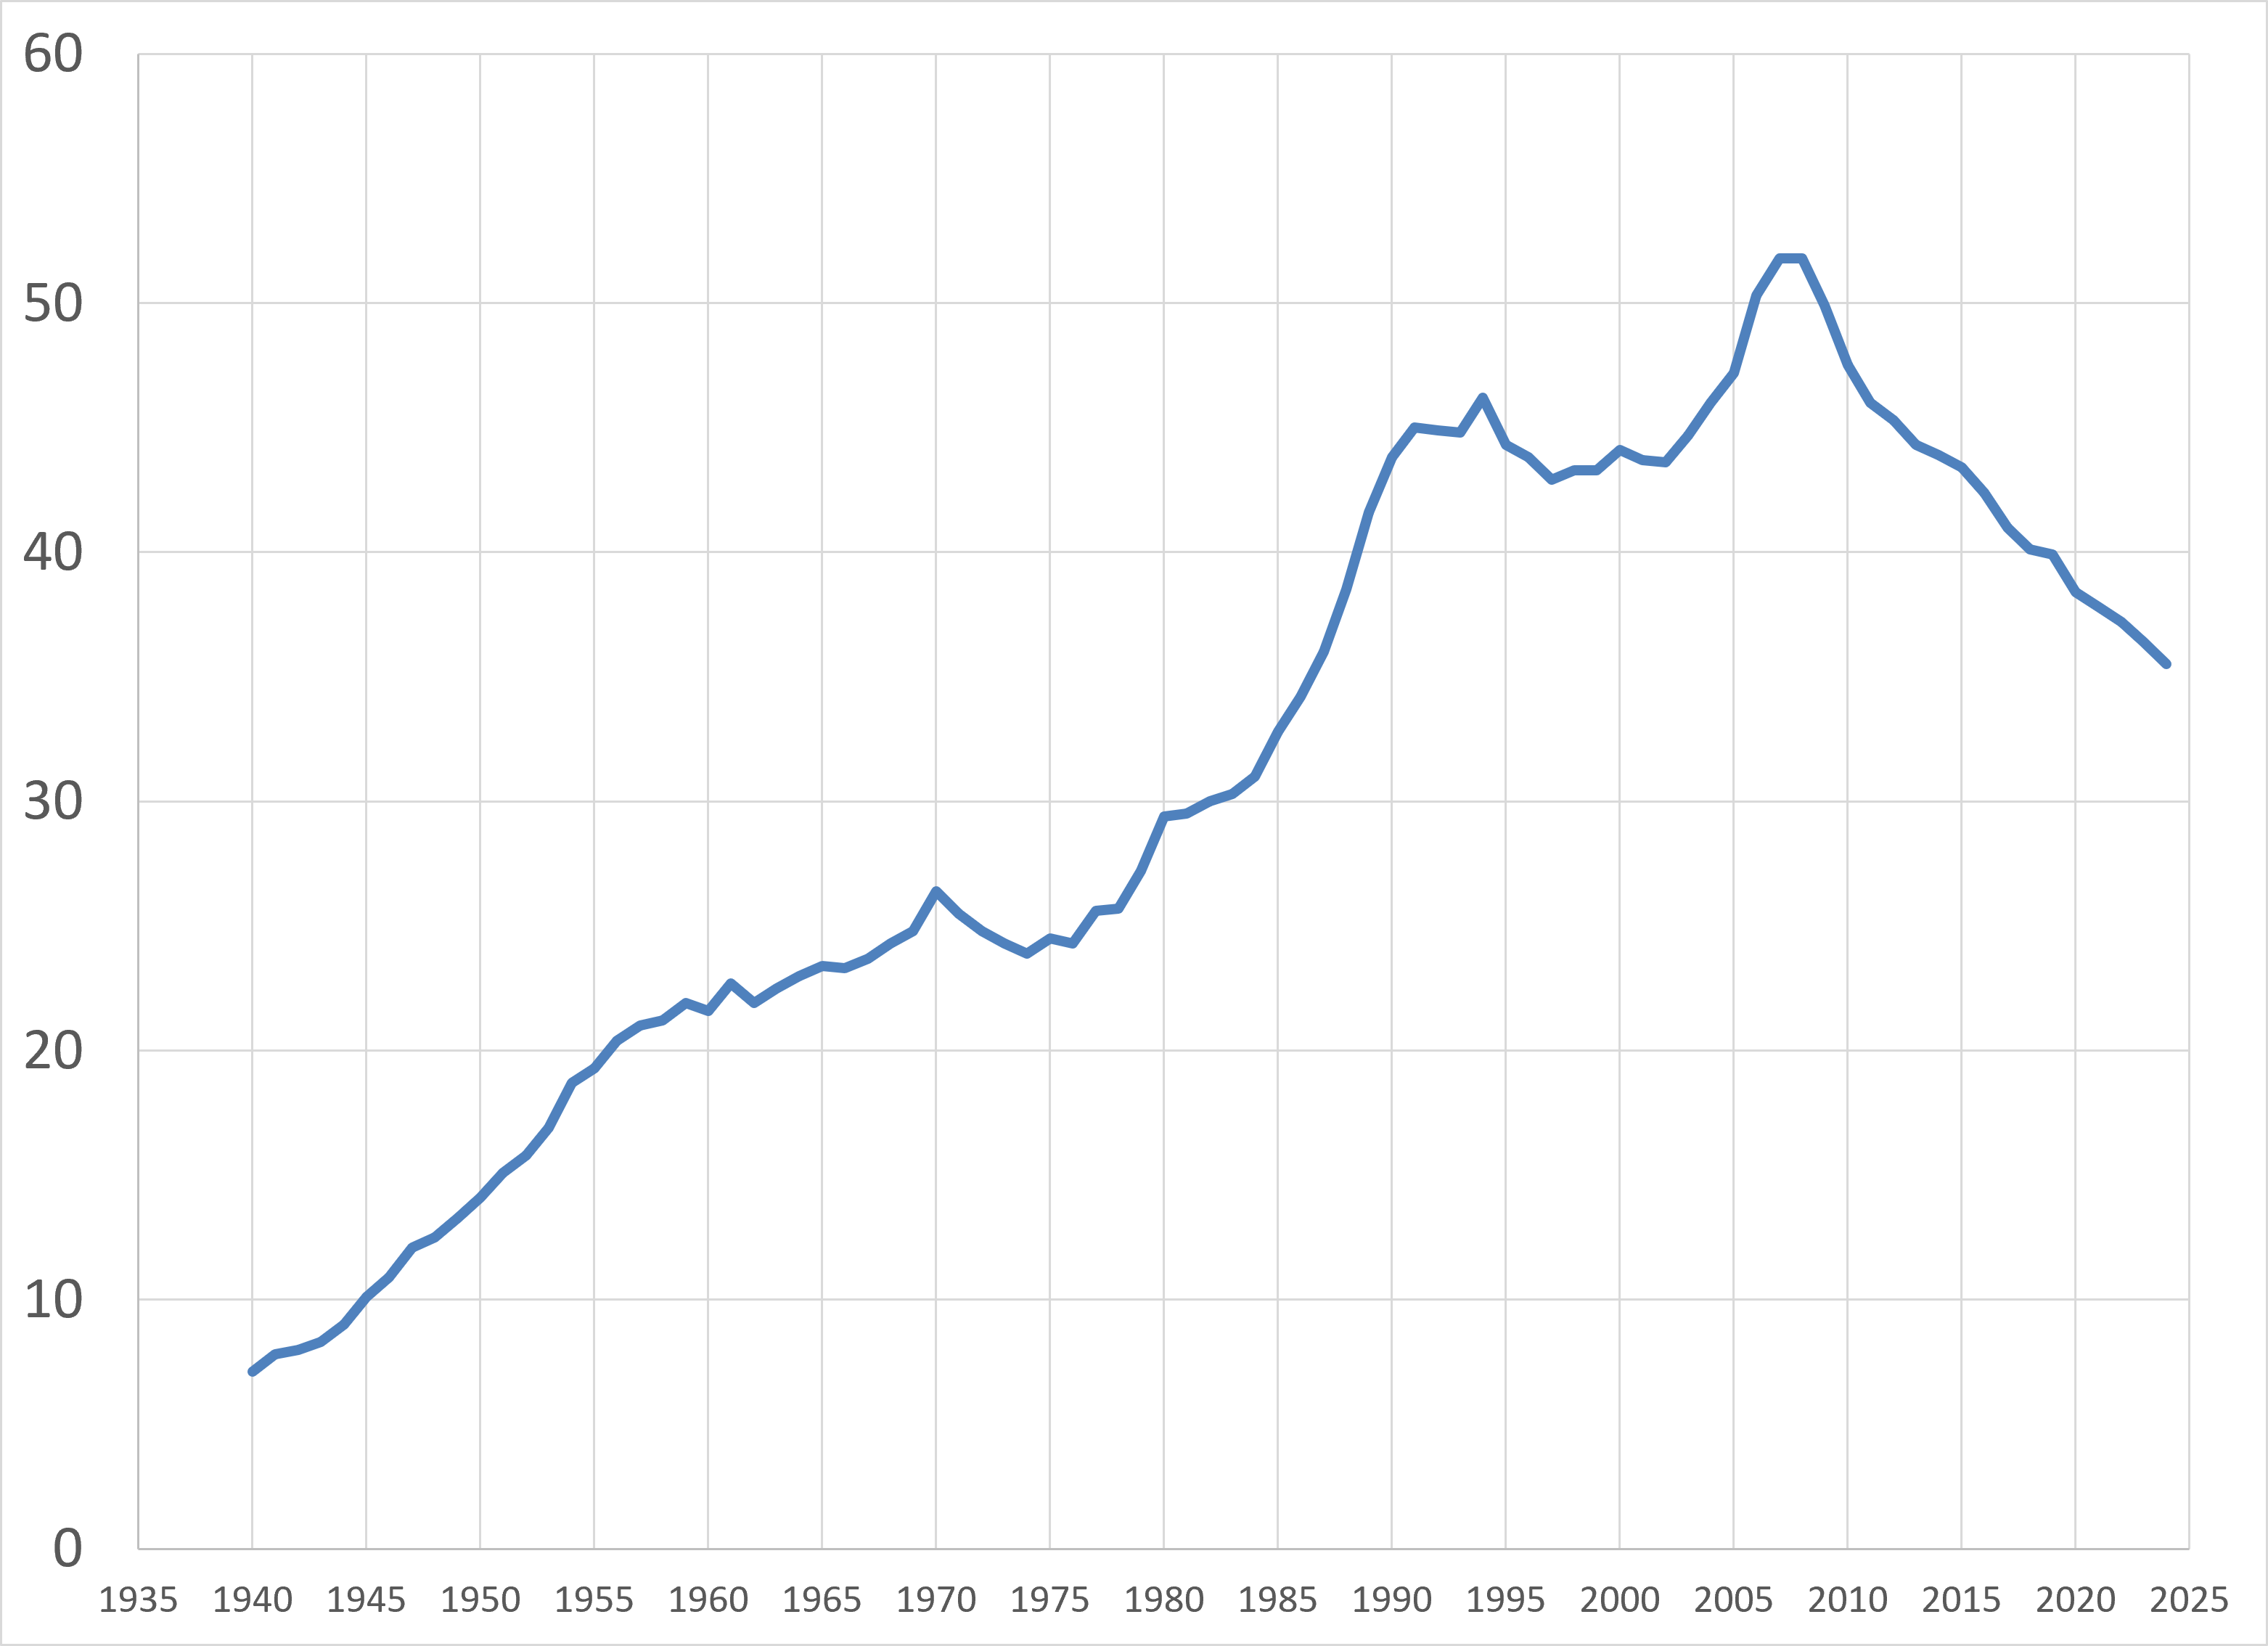
Demographic patterns behind trends in nonmarital birthrates also suggest an important role for welfare reform. Unmarried women, younger women, and socioeconomically disadvantaged women receive cash welfare at higher rates than their counterparts.15 The birthrate trends among these groups are what we would expect if welfare reform changed behavior.
Specifically, the birthrate among married women fell between 1970 and 1996 but then increased through 2007. It has moved up and down since, and while the marital birthrate has declined since 2016, it was higher than in 1996 as recently as 2019. So, the large decline in the nonmarital birth rate was not matched by a similar trend for married women, largely unaffected by welfare reform.
The teen birthrate peaked in 1994 and has fallen by roughly two-thirds. The nonmarital birthrate fell by 84 percent among women ages 15-17 from 1994 to 2024, 69 percent among women ages 18-19, 40 percent among women 20-24, and 3 percent among those 25-29 years old. Among older women, the nonmarital fertility rate increased. This pattern, too, correlates with exposure to welfare reform and also supports a role for reform.
Data on nonmarital births by education or income are not readily available, but we can use race as a proxy for socioeconomic disadvantage. The nonmarital birth rate among African American women fell by 49 percent from 1989 to 2024, while the rate for white women rose through 2008 before declining. Within every age group, nonmarital fertility trends improved more for black women than for white women over the period.
Poverty Plummeted before and After Welfare Reform among Children & Single Parents
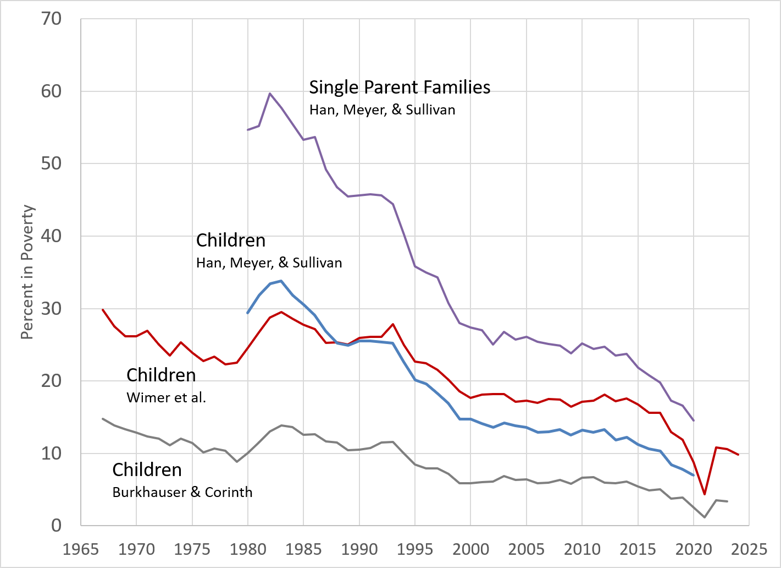
These striking trends strongly suggest that welfare reform succeeded in increasing work and reducing unwed pregnancies and births among the populations that would have received welfare before reform. Partly as a consequence, children and single parents saw poverty declines that can only be called massive. The three best measures available indicate that between 1996 and 2022, the child poverty rate fell by somewhere between 52 percent and 78 percent.16 The poverty rate among single-parent families fell by a similar magnitude.17
While there is really no contesting the progress made vanquishing child poverty, some critics have claimed that welfare reform does not deserve the credit. It certainly should not receive all the credit. Child poverty and poverty among single parent families fell by a lot starting in 1983 or 1984. But the reasons for the fall in poverty before and after welfare reform are instructive.
Some opponents of welfare reform cite expansions of other parts of the safety net since 1996 to explain the decline in poverty. It is true that spending on antipoverty programs has ballooned. My colleagues, Matt Weidinger and Angela Rachidi, recently analyzed federal spending on children as estimated by Urban Institute researchers. In real, inflation-adjusted terms, expenditures on low-income children in four categories rose 150 percent from 1996 to 2023 (by $249 billion, covering income security, refundable tax credits, and health and nutrition programs). From other federal data, they conclude that federal means-tested spending (not just on children) doubled between 2008 and 2023. 18
But the idea that this expansion was the driver of poverty declines after welfare reform gets things backward—transfers were more important relative to earnings before welfare reform than they were after. My colleagues, Richard Burkhauser and Kevin Corinth, show that from 1967 to 1993, while child poverty fell by 3 percentage points when looking at income after taxes and transfers, using a pre-tax and -transfer measure shows child poverty rising by 5 points.19 That does not necessarily mean that absent the safety net, child poverty would have increased over these pre-PRWORA years—safety net benefits may have simply substituted for the earnings that parents would have obtained if they’d had to work. But it does mean that families with children became more dependent on government transfers during this 26-year span.
In contrast, as of 2023, pre-tax and -transfer poverty among children was not just lower than in 1993, it was lower than post-tax and -transfer poverty was in 1993. That is to say, increases in earnings have been large enough among families with children that if the entire safety net disappeared tomorrow, the child poverty rate would still be lower than in 1993. 20
An Alternative Narrative Develops 21
Most of the trends laid out above were evident ten years ago, when PRWORA turned twenty. However, a campaign was shaping up among reform’s discontents to discredit the policy and build support for a new vision of the safety net. These critics essentially turned their focus to a smaller subset of low-income families—the poorest of the poor. They claimed that this still-sizable group had been harmed by welfare reform, because its emphasis on work left behind those with barriers to employment.
The way to help this group, the critics argued, was to enact a child allowance, universal below some upper-income threshold. A child allowance would provide unconditional cash to families without a work requirement attached, just as AFDC had done. The campaign paid off in 2021, when child allowances were briefly part of the American safety net.
The founding document of the revisionist history of poverty after welfare reform was a book published in 2015—$2 a Day: Living on Almost Nothing in America, by Kathryn Edin and Luke Shaefer.22 As its title suggested, Edin and Shaefer claimed that 1.5 million American households were getting by on $2 per person per day, or $2,190 per year for a family of three. The ranks of people in “extreme poverty” had been rising since the mid-1990s, and the book made clear that welfare reform was to blame.
Later in 2015, Representatives Barbara Lee and Lucille Roybal-Allard quietly inserted language into an appropriations bill that became law that would lay the groundwork for a child allowance. directing the Department of Health and Human Services to request a National Academy of Sciences (NAS) report on reducing child poverty. The NAS panel began its work on the report in 2017, a year that also saw Democrats in the House and Senate sponsor child allowance bills.
In 2018, Edin, Shaefer, and eight other influential scholars published an article advocating a child allowance in the Russell Sage Foundation Journal of the Social Sciences.23 At the time, the foundation was partially bankrolling the NAS panel, and three of the article authors were serving as panel members, one as its chair.
The NAS report, released in 2019, found that the most effective way to reduce child poverty would be to convert the existing child tax credit (CTC) to a child allowance.24 Doing so, the report concluded, would pull up to four million children out of poverty.
That conclusion, however, relied on several assumptions. The most important was embedded in the statistical modeling two panel members directed to estimate the impact of the child allowance. The modeling assumed that few families would respond to the availability of unconditional benefits by working less. Like other proponents of a child allowance, the panel members had a short-sighted view of how the policy might alter behavior.
The problem with AFDC, proponents argued, was its “phase-out”—the feature that reduced benefits with each additional dollar of earnings. The phase-out created a work disincentive that trapped beneficiaries on welfare. A child allowance was different—being nearly universal, it lacked a phase-out for all but the richest families. Thus, there was little reason to think that a child allowance would have the work and marriage disincentives embedded in AFDC.
With an assist from the COVID-19 epidemic, which loosed a torrent of federal assistance, Democrats passed and President Joseph Biden signed a temporary child allowance into law in early 2021. Before the ink from the presidential pen was dry, policymakers began a push to make the reform permanent. They received outside help from over 400 economist signatories to a letter advocating for a permanent child allowance.25 The letter cited the NAS report’s contention that the policy would have minimal impacts on work—a conclusion drawn from the statistical modeling that one of the letter’s organizers had led on the NAS panel itself.
It is not an exaggeration to say that this entire campaign to reverse the supposed harm done by welfare reform rested on a bed of empirical mistakes. The Edin-Shaefer research on extreme poverty was quickly and thoroughly debunked. One study found that taking seriously the basic survey data, a large fraction of people supposedly living on $2 a day per person actually had a per-person income of one cent per day.26 My own research showed that the supposed rise in extreme poverty began in the 1970s, not in the mid-1990s, and that it occurred among even well-off groups unaffected by welfare reform, such as college-educated married couples.27 After addressing known problems with the survey data, I found extreme poverty was practically non-existent. Bruce Meyer and his colleagues found the same result using better-measured administrative data. 28 Those families supposedly in extreme poverty reported specific hardships no more often than other poor families.
More plausibly, other critics cited a rise in “deep poverty”—living under half the official poverty line. But Corinth and Meyer’s research using administrative data debunked that too. Their paper with Derek Wu showed that deep poverty among single parent families had fallen from 4.4 percent in 1995 to 3.8 percent or less in 2016. 29 Rector reported, in research with Jamie Hall, that families that survey data suggested were in deep poverty were no more likely to experience hardships such as heating problems than other families in poverty, reinforcing that most of the phenomenon involved measurement issues.30
The NAS panel’s contention that a child allowance would not reduce work much was based not on bad data but faulty reasoning. The panel members, like other child allowance advocates, argued that universal benefits, lacking a phase-out but also a phase-in of benefits as families work more, did not affect the decision to work or not work all that much. However, this logic ignored the fact that the policy a child allowance would replace included a phase-in that incentivized work. Taking that phase-in away would be expected to discourage work for the same reason that AFDC’s phase-out discouraged it more than a universal benefit would have.
Late in the policy debate over making the child allowance permanent, Corinth and Meyer released a study with two colleagues pointing out this problem and estimating its importance. 31 Using an estimate drawn from the academic literature indicating how sensitive work is to change in the payoff to working, they determined that nearly 1.5 million people would stop working if a child allowance became permanent, responding to the elimination of the CTC’s phase-in. That would counter the anti-poverty impact of giving people unconditional cash, reducing it by one-third.
The universal allowance fell just shy of passing. Corinth and Meyer’s research was criticized, but they were vindicated by a second NAS report released this year that affirmed that their assumptions were appropriate.32
The Future of Safety Net Reforms
It is apparent, then, that despite ample evidence, the 1996 welfare reforms will need continued defending. There are reasons for optimism and pessimism. On the one hand, the recent enactment of the One Big Beautiful Bill Act extended the work-based approach to reforming the safety net in important ways. It substantially beefed up what had been largely ineffectual work requirements in the Supplemental Nutrition Assistance Program (SNAP, or food stamps). It also instituted federal work requirements for able-bodied Medicaid recipients. We should watch carefully to see what happens as more beneficiaries are directed into employment.
As written, the requirements are tough and enforceable, but also compassionate in that they may be fulfilled via a number of activities (including community service) and include broad exemptions from the work requirement for various classes of beneficiaries (including the physically and mentally disabled, parents of children under age 13 or 14, pregnant women, students enrolled at least half-time, and participants in drug or alcohol treatment programs). While states may tighten up the requirement, by default, non-exempt Medicaid recipients must engage in activity only for 20 hours per week in one month every six months.
On the other hand, interest in not only a child allowance but universal basic income (UBI) continues to build. Polling still suggests these policies are relatively unpopular, but their base of support is widening from progressive advocates to populist conservatives and tech company executives. Fears that artificial intelligence will produce mass unemployment are overwrought given the long history of technological innovation making us richer rather than poorer, but those concerns will aid long-time advocates of unconditional cash.
Dozens of local policy experiments providing a guaranteed basic income have been funded—often with emergency COVID-19 dollars from the federal government—and implemented, efforts that are ongoing. An infrastructure of funders (some associated with artificial intelligence companies), mayors, and evaluators has generated substantial attention for these efforts. They are well designed to demonstrate any short-term benefits of temporarily giving unconditional cash to poor families while avoiding discovery of the long-term problems that a permanent program would bring. After all, fewer people will alter their work (or marital or fertility) decisions in response to a temporary income boost they know will go away as compared with how they would react to a permanent guaranteed income over the long run.
Even so, the most rigorous of these studies offers ample reason to worry about the unintended consequences of a guaranteed basic income. The Open Research Guaranteed Income Study—backed by OpenAI’s Sam Altman—provided $1,000 a month for three years to families in Illinois and Texas.33 The study found that receipt of the transfer lowered employment by four percentage points relative to the control group, which received $50 a month. For every $1 in transfers a family received, they reduced the non-transfer income they received by 28 cents. Among families headed by someone without a college degree, the reduction was 44 cents to the dollar.
These estimates understate the impact of substituting a guaranteed income for work-incentivizing programs like the EITC and CTC. Doing so would alter the trade-off between working and not working—the effect that economists debated during the child allowance showdown.
Thirty years ago, the nation hit on an effective set of policy reforms that reduced government dependence, increased employment, slashed out-of-wedlock childbearing, lowered the share of children living without two parents, and reduced poverty. It should go without saying that we should build on the lessons of welfare reform as we continue our vital efforts to reduce hardship and expand opportunity for all.
Footnotes
- Average number of families receiving AFDC or TANF benefits for 1961-2022 is from Gene Falk and Patrick A. Landers, “The Temporary Assistance for Needy Families (TANF) Block Grant: Responses to Frequently Asked Questions,” 2024, Congressional Research Service, RL32760, Table A1, https://www.congress.gov/crs-product/RL32760. For 2023 and 2024, from U.S. Department of Health and Human Services, Administration for Children and Families, Office of Family Assistance, “Temporary Assistance for Needy Families (TANF) and Separate State Programs (SSP)—Maintenance-of-Effort (MOE) Caseload Data, Fiscal Year 2023,” December 27, 2023 and “FY2024 15 Months TANF & SSP-MOE Caseload Data, June 10, 2025,” https://acf.gov/sites/default/files/documents/ofa/fy2023_tanssp_caseload.xlsx
and https://acf.gov/sites/default/files/documents/ofa/fy2024-15months-tanssp-caseload.xlsx. Author’s calculation of the calendar-year average monthly number of families, using the FY2023 and FY2024 tables, excluding Guam, Puerto Rico, and the U.S. Virgin Islands. I multiply each year by 95 percent as an approximation of the share of such families that are headed by a single parent, based on figures for 1962-2013 at U.S. Department of Health and Human Services, Welfare Indicators and Risk Factors: Fourteenth Report to Congress, 2015, Table TANF 1. Trends in AFDC/TANF Average Monthly Caseloads: 1962-2013, https://aspe.hhs.gov/reports/welfare-indicators-risk-factors-fourteenth-report-congress-0. Number of female- and male-headed households with children and no spouse present from U.S. Census Bureau, Historical Poverty Tables: People and Families – 1959 to 2024, Table 4. Poverty Status of Families by Type of Family, Presence of Related Children, Race, and Hispanic Origin: 1959 to 2024, https://www2.census.gov/programs-surveys/cps/tables/time-series/historical-poverty-people/hstpov4.xlsx. - US House of Representatives, 1996 Green Book: Background Material and Data on Programs Within the Jurisdiction of the Committee on Ways and Means, Table 8-27, https://aspe.hhs.gov/system/files/aspe-files/210906/08tanf.txt. Number of child AFDC/TANF recipients for 1961-2022 is from Falk and Landers, “The Temporary Assistance for Needy Families (TANF) Block Grant,” Table A1. For 2023 and 2024, estimates are from U.S. Department of Health and Human Services, Welfare Indicators and Risk Factors, Table TANF 2. Number of AFDC/TANF Recipients, and Recipients as a Percentage of Various Population Groups: 1970-2013. Number of children under 18 is from U.S. Census Bureau, Population Division, Population Estimates Program, National Intercensal Population Estimates by Age and Sex, historical estimates for 1960–1990 and intercensal estimates for 1980–1990, 1990–2000, 2000–2010, and 2010–2020; and Annual Estimates of the Resident Population for Selected Age Groups by Sex for the United States: April 1, 2020 to July 1, 2025 (NC-EST2025-AGESEX), Vintage 2025.
- Author’s calculations using data from the Annual Social and Economic Supplement to the Current Population Survey, tabulated with the Survey Documentation and Analysis tool hosted by IPUMS CPS at the University of Minnesota. Sarah Flood, Miriam King, Renae Rodgers, Steven Ruggles, J. Robert Warren, Daniel Backman, Etienne Breton, Grace Cooper, Julia A. Rivera Drew, Stephanie Richards, David Van Riper, and Kari C.W. Williams. IPUMS CPS: Version 13.0 [dataset]. Minneapolis, MN: IPUMS, 2025. https://doi.org/10.18128/D030.V13.0.
- For reviews, see James P. Ziliak, “Temporary Assistance for Needy Families,” 2016, in Economics of Means-Tested Transfer Programs in the United States, Volume 1, ed. Robert A. Moffitt (Chicago: University of Chicago Press); and Marc K. Chan and Robert A. Moffitt, “Welfare Reform and the Labor Market,” 2018, Annual Review of Economics 10: 347–81, https://www.annualreviews.org/doi/abs/10.1146/annurev-economics-080217-053452.
- Jeffrey Grogger, “The Effects of Time Limits, the EITC, and Other Policy Changes on Welfare Use, Work, and Income among Female-Headed Families,” 2003, The Review of Economics and Statistics 85(2): 394-408, https://direct.mit.edu/rest/article-abstract/85/2/394/57401/The-Effects-of-Time-Limits-the-EITC-and-Other.
- Hanming Fang and Michael P. Keane, “Assessing the Impact of Welfare Reform on Single Mothers,” 2004, Brookings Papers on Economic Activity 35, no. 1: 1–116, https://www.brookings.edu/bpea-articles/assessing-the-impact-of-welfare-reform-on-single-mothers/. Single mother employment rates for 1968-1993 and 2002-2025 are from my analysis of CPS IPUMS data.
- Scott Winship and Christopher Jencks, “How Did the Social Policy Changes of the 1990s Affect Material Hardship among Single Mothers? Evidence from the CPS Food Security Supplement,” 2004, Harvard University, John F. Kennedy School of Government, working paper, https://www.hks.harvard.edu/publications/how-did-social-policy-changes-1990s-affect-material-hardship-among-single-mothers.
- Henrik Kleven, “The EITC and the Extensive Margin: A Reappraisal,” 2024, Journal of Public Economics 236: 105135, https://www.sciencedirect.com/science/article/abs/pii/S0047272724000719; Adam Looney, “Welfare Reform and the Earned income tax credit in the 1990s,” 2026, working paper, https://www.brookings.edu/wp-content/uploads/2026/03/EITC-Brookings-Working-Paper.pdf.
- Urvi Patel, “Reproductive Justice and TANF: Repealing ‘Family Cap’ Policies Promotes Economic Justice and Family Autonomy,” 2023, Center on Budget and Policy Priorities, https://www.cbpp.org/blog/reproductive-justice-and-tanf-repealing-family-cap-policies-promotes-economic-justice-and.
- For a concise review, see Rachel Sheffield and Scott Winship, “The Demise of the Happy Two-Parent Home,” 2020, US Congress Joint Economic Committee, https://www.jec.senate.gov/public/index.cfm/republicans/2020/7/the-demise-of-the-happy-two-parent-home.
- Scott Winship, “A Half-Century Decline in Marriage…That Ended 30 Years Ago for Disadvantaged Kids,” 2022, American Enterprise Institute, https://www.aei.org/wp-content/uploads/2022/04/Half-Century-Decline-in-Marriage-.-.-.-That-Ended-30-Years-Ago-for-Disadvantaged-Kids.pdf.
- Pregnancy rates for 1990-2008 are from Stephanie J. Ventura et al., “Estimated Pregnancy Rates and Rates of Pregnancy Outcomes for the United States, 1990–2008,” 2012, National Vital Statistics Reports 60, no. 7, https://www.cdc.gov/nchs/data/nvsr/nvsr60/nvsr60_07.pdf. Pregnancy rate for 2009 is from Sally C. Curtin, Joyce C. Abma, and Stephanie J. Ventura, “Pregnancy Rates for U.S. Women Continue to Drop,” 2013, NCHS Data Brief no. 136, https://www.cdc.gov/nchs/products/databriefs/db136.htm; Pregnancy rates for 2010-2019 are from Lauren M. Rossen et al., Updated Methodology to Estimate Overall and Unintended Pregnancy Rates in the United States, 2023, Vital and Health Statistics, Series 2, no. 201, https://www.cdc.gov/nchs/data/series/sr_02/sr02-201.pdf.
Pregnancy rates for 1973-1989 were estimated as the sum of the nonmarital birth rate, nonmarital abortion rate, and nonmarital fetal loss rate. Nonmarital birth rates for those years are from https://www.cdc.gov/nchs/data/databriefs/db162_table.pdf. Nonmarital abortion rates are from Stanley K. Henshaw and Kathryn Kost, Trends in the Characteristics of Women Obtaining Abortions, 1974 to 2004, 2008, Guttmacher Institute, supplemental Tables 2a–2c, https://www.guttmacher.org/report/trends-characteristics-women-obtaining-abortions-1974-2004-supplemental-tables. I multiply them by 1.05 for consistency with the estimates after 1989, which treat separated women as married, based on the relationship between the two different rates in 1980, when both are available. Before 1976, the Guttmacher rates are based on 24-31 states. Nonmarital fetal losses are estimated as 25 percent of nonmarital births, based on the relationship between the two in 1980 (see https://www.cdc.gov/nchs/data/series/sr_21/sr21_056.pdf) and in the 1990s.
There is a methodological break in the series between 2009 and 2010, producing a large downward jump. I adjusted the 2010-2019 estimates upward by the same fixed amount each year. To obtain that amount, I turned to black pregnancy rates, for which 2010 estimates are available using both the pre-2010 methods and the methods from 2010 forward. (See https://www.cdc.gov/nchs/data/databriefs/db136_tables.pdf and
https://www.cdc.gov/nchs/data/series/sr_02/sr02-201.pdf.) (Around 80 percent of the pregnancies of black women were nonmarital—see https://www.cdc.gov/nchs/data/nvsr/nvsr60/nvsr60_01.pdf for births to black women and birthrates by marital status, and see https://www.cdc.gov/nchs/data/databriefs/db136_tables.pdf for pregnancy rates by marital status.) For the adjustment, I multiplied the unadjusted 2010 nonmarital pregnancy rate by [(2010 black pregnancy rate, old methods / 2009 black pregnancy rate, old methods) / (2010 black pregnancy rate, new methods / 2009 black pregnancy rate, old methods)] to estimate the 2010 nonmarital pregnancy rate under the old methods. Then I shifted all of the 2011-2019 rates upward by the same constant 2010 adjustment.
These estimates all refer to marital status as of the end of the pregnancy. This undercounts nonmarital pregnancies because some couples marry between getting pregnant and becoming parents. The series that adjusts for shotgun marriage uses estimates of the share of nonmarital pregnancies that are followed by a pre-birth marriage. (See U.S. Congress Joint Economic Committee, 2017, Love, Marriage, and the Baby Carriage: The Rise in Unwed Childbearing, Figure 13, https://www.jec.senate.gov/public/index.cfm/republicans/2017/12/love-marriage-and-the-baby-carriage-the-rise-in-unwed-childbearing.) It divides the calculated pregnancy rate by the share of nonmarital pregnancies that were not followed by a shotgun marriage and birth to estimate the true nonmarital pregnancy rate. It uses 1970-74 share for 1973, the 1980-84 share for 1982, 1990-94 share for 1992, 1995-1999 share for 1997, the 2000-04 share for 2002, and the 2005-09 share for 2007. The JEC shotgun marriage series was extended to 2012 using the 2015-17 and 2017-19 National Survey of Family Growth files available at https://ftp.cdc.gov/pub/Health_Statistics/NCHS/Datasets/NSFG/ and the unadjusted nonmarital pregnancies previously estimated (shotgun marriage birth share of nonmarital pregnancies = shotgun marriage births / sum of shotgun marriage births and unadjusted nonmarital pregnancies). - Stephanie J. Ventura and Christine A. Bachrach, “Nonmarital Childbearing in the United States, 1940-99,” 2000, National Center for Health Statistics, National Vital Statistics Report 48(16) (Revised), Table 3, https://www.cdc.gov/nchs/data/nvsr/nvsr48/nvs48_16.pdf; Joyce A. Martin, Brady E. Hamilton, Michelle J.K. Osterman, Anne K. Driscoll, and T.J. Mathews, 2017, “Births: Final Data for 2015,” National Center for Health Statistics, National Vital Statistics Report 66(1), Table 16, https://www.cdc.gov/nchs/data/nvsr/nvsr66/NVSR66_01.pdf; Michelle J.K. Osterman, Brady E. Hamilton, Joyce A. Martin, Anne K. Driscoll, and Claudia P. Valenzuela, 2026, “Births: Final Data for 2024,” National Center for Health Statistics, National Vital Statistics Report 75(2), Table 7, https://www.cdc.gov/nchs/data/nvsr/nvsr75/nvsr75-02.pdf.
- Robert Rector, “Marriage, Abortion, and Welfare,” 2023, Heritage Foundation, https://www.heritage.org/welfare/report/marriage-abortion-and-welfare.
- Scott Winship, “Will Welfare Reform Increase Upward Mobility?” 2015, Forbes.com, https://www.forbes.com/sites/scottwinship/2015/03/26/will-welfare-reform-increase-upward-mobility/.
- The Columbia University Center on Poverty and Social Policy has a post-tax and -transfer “anchored SPM poverty rate” that falls 22.4% to 10.8% among children, or 52 percent. Jeehoon Han, Bruce Meyer, and James Sullivan report a post-tax and -transfer child poverty rate that declines from 27.6% to 13.1%, a drop of 53 percent, and a consumption poverty rate falling from 29.4% to 6.6%, or 78 percent. Richard Burkhauser and Kevin Corinth show a post-tax and -transfer child poverty rate that falls from 7.9% to 3.5% (decline of 55 percent). (Christopher Wimer, Liana Fox, Sophie Collyer, Irwin Garfinkel, Neeraj Kaushal, Jennifer Laird, Jaehyun Nam, Laura Nolan, Jessica Pac, Ryan Vinh, and Jane Waldfogel, 2025, Historical Supplemental Poverty Measure data, New York: Center on Poverty and Social Policy, Columbia University, https://povertycenter.columbia.edu/historical-spm-data. Jeehoon Han, Bruce D. Meyer, and James X. Sullivan, “Annual Report on U.S. Consumption Poverty: 2022,” 2023, Table 1, https://sites.nd.edu/james-sullivan/files/2023/10/2022-Consumption-Poverty-Report_10_20_2023.pdf. Richard V. Burkhauser and Kevin Corinth, “Poverty and Dependency in the United States, 1939-2023,” NBER Working Paper 34759, Cambridge, MA: National Bureau of Economic Research, Figure 2, https://www.nber.org/system/files/working_papers/w34759/w34759.pdf.) I thank Kevin Corinth for providing the data behind the figures in his paper with Burkhauser.
- Using administrative data, Kevin Corinth, Bruce Meyer, and Derek Wu found that a post-tax and -transfer poverty rate fell by 56 to 62 percent among single parent families between 1996 and 2016. Han, Meyer, and Sullivan report poverty declining by 53 to 72 percent among single parent families from 1996 to 2019, a period for which they report a 40 to 73 percent drop among children using similar measures. (Kevin Corinth, Bruce D. Meyer, and Derek Wu, “The Change in Poverty from 1995 to 2016 among Single Parent Families,” 2022, AEA Papers and Proceedings 112: 345-350, Table 2, https://bpb-us-w2.wpmucdn.com/voices.uchicago.edu/dist/d/1370/files/2017/05/P-and-P-Submitted-Version.pdf. Jeehoon Han, Bruce D. Meyer, and James X. Sullivan, “Who Is Poor, How Poverty Has Changed, and Why It Matters: Poverty Measurement in the U.S. and Its Implications for Policy,” 2022, Working Paper, Tables 2 and 3 https://sites.nd.edu/james-sullivan/files/2023/04/Han_Meyer_Sullivan_Poverty_v21.pdf.
- Matt Weidinger and Angela Rachidi, “Designing an Opportunity-Based Safety Net,” 2026, in Kevin Corinth and Scott Winship, eds., Land of Opportunity: Advancing the American Dream, American Enterprise Institute, Figures 2 and 3, https://cosm.aei.org/land-of-opportunity/.
- Burkhauser and Corinth, “Poverty and Dependency in the United States, 1939-2023,” Figures 7 and 7. I thank Corinth for providing the data behind the figures.
- These estimates do not take account of health insurance, either employer-sponsored or government-sponsored, in estimating family income. Valuing health insurance is a complicated matter. See Scott Winship, “Poverty after Welfare Reform,” 2016, Manhattan Institute, Appendix 1, https://media4.manhattan-institute.org/sites/default/files/R-SW-0816.pdf.
- This section draws on my recent piece with Kevin Corinth, “The Ongoing Battle to Defend Welfare Reform,” 2026, National Review Online, https://www.nationalreview.com/2026/08/the-ongoing-battle-to-defend-welfare-reform/.
- Kathryn J. Edin and H. Luke Shaefer, $2 a Day: Living on Almost Nothing in America, 2015, Houghton Mifflin Harcourt.
- H. Luke Shaefer et al., “A Universal Child Allowance: A Plan to Reduce Poverty and Income Instability Among Children in the United States,” 2018, The Russell Sage Foundation Journal of the Social Sciences 4(2): 22-42, https://www.rsfjournal.org/content/4/2/22.
- National Academies of Science, Engineering, and Medicine, 2019, A Roadmap to Reducing Child Poverty, https://www.nationalacademies.org/projects/DBASSE-BCYF-16-05/publication/25246.
- https://static1.squarespace.com/static/5ecd75a3c406d1318b20454d
/t/6148f183c62fb147d0d25138/1632170373799/Economist+CTC+Letter+9-14-21+430pm.pdf - Cory Smith and Laurence Chandy, “How Poor Are America’s Poorest? U.S. $2 A Day Poverty In A Global Context,” 2014, Brookings Institution, https://www.brookings.edu/articles/how-poor-are-americas-poorest-u-s-2-a-day-poverty-in-a-global-context/.
- Scott Winship, “Poverty after Welfare Reform”
- Bruce D. Meyer, Derek Wu, Victoria R. Mooers, and Carla Medalia, “The Use and Misuse of Income Data and Extreme Poverty in the United States,” 2020, Journal of Labor Economics 39(S1), https://www.journals.uchicago.edu/doi/abs/10.1086/711227.
- Kevin Corinth, Bruce D. Meyer, and Derek Wu, 2022, “The Change in Poverty from 1995 to 2016 among Single Parent Families,” AEA Papers and Proceedings 112: 345-350, https://bpb-us-w2.wpmucdn.com/voices.uchicago.edu/dist/d/1370/files/2017/05/P-and-P-Submitted-Version.pdf.
- Jamie Hall and Robert Rector, “Examining Extreme and Deep Poverty in the United States,” 2018, Heritage Foundation, https://www.heritage.org/poverty-and-inequality/report/examining-extreme-and-deep-poverty-the-united-states.
- Kevin Corinth, Bruce D. Meyer, Matthew Stadnicki, and Derek Wu, “The Anti-Poverty, Targeting, and Labor Supply Effects of Replacing a Child Tax Credit with a Child Allowance,” 2022, NBER Working Paper No. 29366, https://www.nber.org/papers/w29366.
- National Academies of Science, Engineering, and Medicine, 2026, “Pathways to Reduce Child Poverty: Impacts of Federal Tax Credits,” https://www.nationalacademies.org/read/29163.
- Eva Vivalt, Elizabeth Rhodes, Alexander W. Bartik, David E. Broockman, Patrick Krause & Sarah Miller, “The Employment Effects of a Guaranteed Income: Experimental Evidence from Two U.S. States,” 2026, National Bureau of Economic Research Working Paper No. 32719, https://www.nber.org/papers/w32719.