Last month the Wall Street Journal editorial board (“The Great Biden Welfare Blowout”) reviewed the staggering number of welfare recipients in key programs at the close of the Biden administration:
Some 84.6 million individuals are enrolled in Medicaid—about a quarter of the population—roughly the same as when Mr. Biden entered office. About 42.6 million Americans receive food stamps, similar to January 2021.
What makes those figures even more shocking is that those massive welfare caseloads remain inflated despite the return of millions of jobs suspended early in the pandemic. As the Journal noted, “The national jobless rate has fallen to 4.1% from the late Covid-era’s 6.3% at the start of the Biden Presidency, yet the welfare rolls haven’t shrunk.” (The U.S. unemployment rate fell to 4.0 percent in January 2025, as subsequently reported by the Department of Labor.)
That trajectory is at odds with how official Washington has long described “automatic stabilizer” programs (including the Supplemental Nutrition Assistance Program or SNAP, commonly called food stamps). That is, programs functioning as an automatic stabilizer should expect receipt of and spending on benefits to grow when unemployment rises and decrease when jobs return.
Here’s how the Congressional Budget Office described that longstanding principle in a November 2024 report titled “Effects of Automatic Stabilizers on the Federal Budget: 2024 to 2034”:
When unemployment is relatively high (above the noncyclical rate of unemployment), federal outlays for unemployment insurance benefits, Medicaid benefits, and Supplemental Nutrition Assistance Program (SNAP) benefits are greater than they otherwise would be because more people qualify for benefits….By contrast, when the economy is operating above its sustainable capacity (when GDP exceeds potential GDP), spending on transfer programs decreases and revenues increase in relation to what they otherwise would be, thus restraining private spending.
But that’s not how things worked out during the past few years, even though former President Biden frequently hailed job creation on his watch. For example, in his farewell address President Biden stated that “we have created nearly 17 million new jobs,” claiming credit for the return of millions of jobs suspended early in the pandemic. Those jobs are reflected in the improving unemployment rate conditions noted above—yet none of those improvements seem to have affected the trajectory of SNAP caseloads or spending during his administration.
As Figure 1 shows, after an initial spike in response to the pandemic, the national SNAP caseload remained remarkably stable at over 41 million recipients, whether the US unemployment rate was 14.8 percent in April 2020 or an average of 6.0 percent in 2021 and 3.6 percent in 2023. Figure 1 also shows that even before Joe Biden became president, recent history had often seen “more people qualify for benefits,” to use CBO’s phrase, seemingly regardless of the direction of the nation’s job market.
Figure 1.
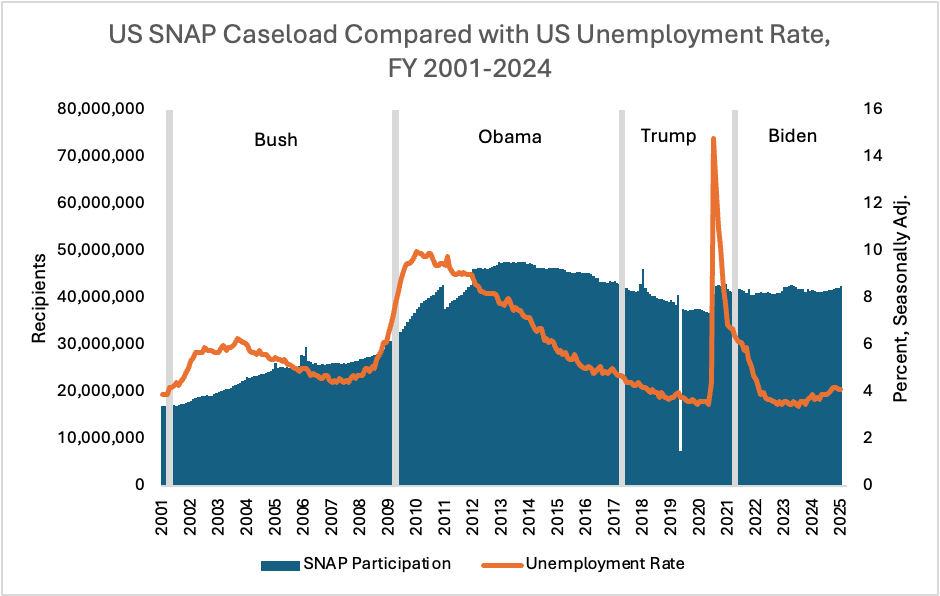
Figure 2 also compares the US unemployment rate with the SNAP caseload, but this time displaying SNAP recipients as a percentage of the US population. It similarly shows how, after an initial spike in response to the pandemic, the percentage of the population receiving SNAP benefits remained remarkably constant even as the unemployment rate plunged from 14.8 percent in April 2020 to 3.6 percent in 2023. Even in 2024—the year after the pandemic officially ended and four years after the crisis started—the share of the population receiving SNAP continued to waver. Nonetheless, the 12.3 percent of the US population receiving SNAP in 2024 still remains above 2019 levels of 11.6 percent.
Figure 2.

Source: USDA, BLS, Census Bureau Intercensal Population Estimates, 2000, 2010, 2020, 2024
After the Great Recession, the share of the US population receiving SNAP benefits peaked at 15.2 percent in 2013 (when the unemployment rate was almost twice the 2024 level) and then declined to 11.4 percent through 2019, as the unemployment rate trended toward historic lows. In a forthcoming report, AEI’s Thomas O’Rourke and Angela Rachidi find that the current share of the US population receiving SNAP benefits is more than double what economic conditions alone would have projected over the past 20 years.
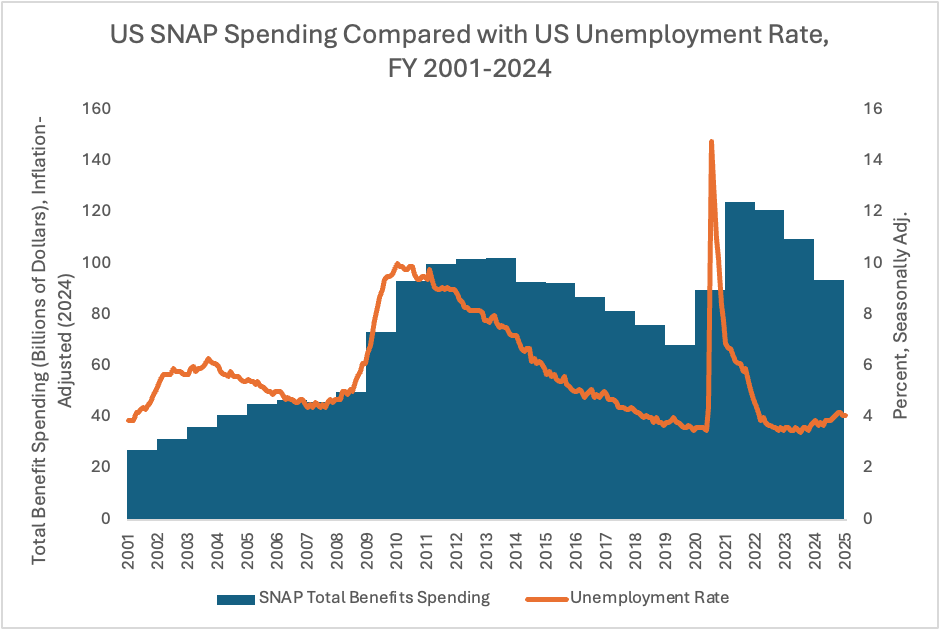
Reinforcing these caseload dynamics, benefit expansions by former President Biden’s administration have affected program spending in recent years as well. As Figure 3 displays, even with generally stable caseloads from 2021 through 2024, inflation-adjusted SNAP spending remained just shy of its fiscal year 2021 peak at $121.2 billion in fiscal year 2022—even as the US unemployment rate was bottoming out at under 4 percent that year.
Figure 3.
The increase in expenditures stemmed from pandemic-related growth, as well as an unprecedented increase in benefit levels resulting from the Biden administration’s reevaluation of the Thrifty Food Plan in 2021. The Thrifty Food Plan is intended to reflect a “low-cost, practical food budget for a household to achieve a healthy diet on a limited budget” and is the basis for setting SNAP benefit levels. Historically, reevaluations had been cost neutral, meaning the types and quantities of food in the Thrifty Food Plan changed, but not the overall cost after adjusting for inflation. Although President Biden’s USDA presented the benefit increase as routine, many in Congress believed their actions were outside the intent of the law. In fact, a review by the nonpartisan Government Accountability Office (GAO) concluded that the Biden administration violated the Congressional Review Act and “lacked key project management elements” to support the reevaluation and subsequent benefit increases.
Increased participation and benefit increases translated into total SNAP spending across the four calendar years of the Biden administration, through October 2024, of $439.7 billion, in current dollars. That compares with a total of $326.3 billion across four full years of the first Trump administration, which includes the pandemic-driven spike in 2020. Taking a longer view, inflation-adjusted SNAP spending in fiscal year 2022 was more than three times spending two decades earlier in 2003, when the US unemployment rate was roughly 50 percent higher. While less than in recent years, FY 2024 spending of $93.8 billion remains approximately $25 billion (37 percent) above the FY 2019 level, before the pandemic and President Biden’s benefit increase. Combining data from Figures 1 and 3 shows how, at similar cyclical lows in the US unemployment rate in 2007, 2019, and 2023, annual SNAP spending per recipient rose significantly in inflation-adjusted terms, growing from $1,747 in 2007 to $1,924 in 2019 and to $2,634 in 2023.
National caseload and spending data are naturally comprised of individual state data. With its large population, California contributes significantly to the national story, and is worth reviewing in its own right. California SNAP caseloads soared to all-time highs even as the state reached record low unemployment rates in 2022. As one of us (Weidinger) explained in a March 2023 Wall Street Journal oped, “In July 2022, when California’s unemployment rate reached a record low of 3.9%, its food-stamp caseload reached a record high of 4.9 million—more than in June 2020, when the state’s unemployment rate was 14.1%.” (California’s unemployment rate subsequently fell to its all-time low of 3.8 percent in August 2022.)
That’s only part of the story. Figure 4 compares caseloads in California with the state’s unemployment rate since 2001. Most notably, California’s SNAP caseload has continued to grow in recent years despite dramatically improved employment conditions. The almost 5.5 million SNAP recipients in October 2024 (when the state’s unemployment rate was 5.4 percent) was over 1.0 million (23 percent) above caseloads from April 2020, when the state’s unemployment rate peaked at 16.1 percent.
Figure 4.
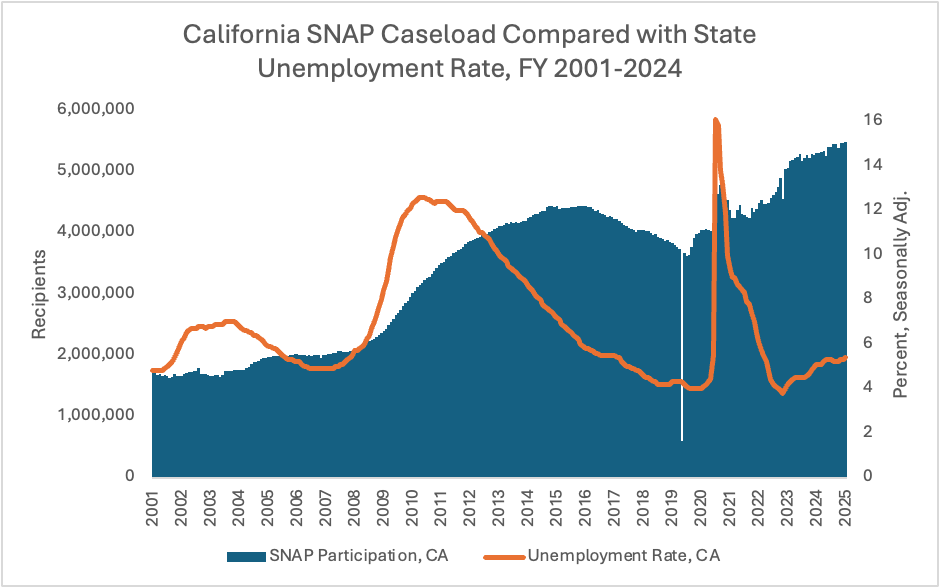
Figure 5 controls for population changes by comparing SNAP caseloads as a percentage of California’s population with the state’s unemployment rate since 2001. In calendar years 2022 and 2023, the percentage of Californians receiving SNAP benefits reached then-record highs – annual averages of 12.3 and 13.5 percent, respectively – even though California’s unemployment rate was among the state’s lowest in 20 years at less than 5 percent. Those records were then eclipsed in 2024, when 13.9 percent of California’s population collected SNAP benefits. In contrast, in 2010 when the state’s unemployment rate peaked at 12.6 percent (more than twice recent levels), just 8.7 percent of the state’s population received SNAP benefits.
Figure 5.
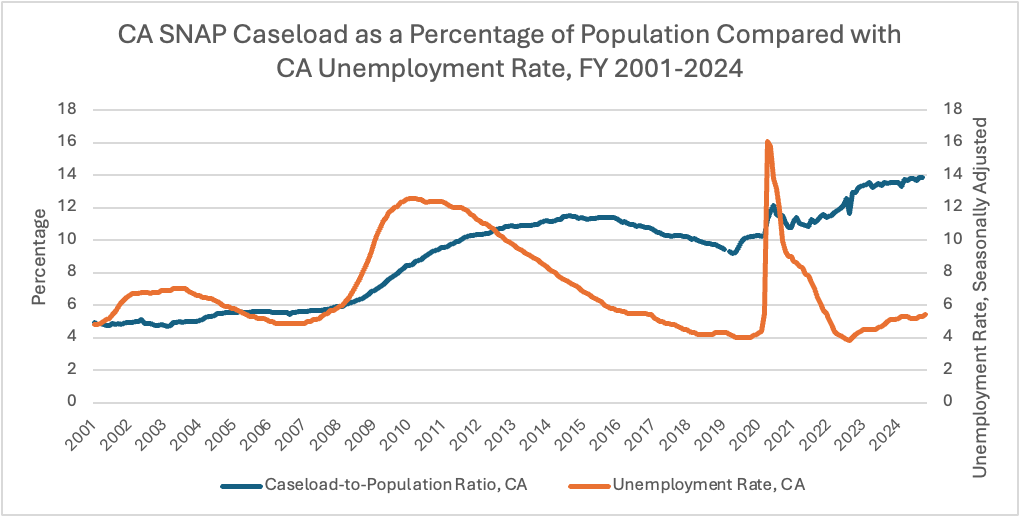
Source: USDA, BLS, Census Bureau Intercensal Population Estimates, 2000, 2010, 2020, 2024
Figure 6 displays the cost implications of SNAP caseload growth in California combined with the continuing effect of President Biden’s benefit increases. Despite dramatic declines in California’s unemployment rate in recent years, and moderation in spending compared with pandemic peaks, annual federal spending on SNAP in California remained 66 percent higher in 2024 than in 2019, in inflation-adjusted dollars.
Figure 6.

Combining data from Figures 4 and 6 shows how, at similar cyclical lows in California’s unemployment rate in 2007, 2019, and 2022, annual SNAP spending per California recipient rose more than 60 percent, growing from $1,899 in 2007 to $2,082 in 2019 and ultimately to $3,040 in 2022.
These national and state caseload and spending figures display how, especially under Biden administration policies, the number of people collecting SNAP benefits and the expense to the federal government have not only spiked, but also have become largely disconnected from improving economic conditions. In other words, instead of benefit receipt and program spending declining as employment conditions improved, we saw no such trend. Indeed, especially compared with pre-pandemic levels, national spending (and California caseloads and spending) markedly increased even as employment conditions were improving in recent years. Spending increases were due to caseload growth and President Biden’s benefit increases. Whatever those dynamics are called, it’s not typical of an automatic stabilizer program.
As the recent WSJ editorial noted, simply returning national SNAP caseloads and spending to pre-Biden administration levels would reflect a significant course correction. Comparing most recent annual national spending with the pre-pandemic year of 2019 suggests that real savings of over $25 billion per year would result from that change alone. Such savings could be deployed elsewhere—or used to stem burgeoning federal debt and deficits. Opponents will of course regard any such changes as a “draconian cut.” But the longer view suggests such changes would reflect reductions only relative to an artificially elevated baseline driven by the conversion of SNAP from an automatic stabilizer into a program that has grown regardless of underlying economic conditions.