Every year, the US Department of Agriculture (USDA) releases a report detailing the share of US households who are “food insecure”—defined as those that have “limited or uncertain access to adequate food” due to insufficient resources. Last month, the USDA released a report combining six years of data (2016-2021) to show how food insecurity rates vary by race and ethnicity. Unsurprisingly, the authors found that relatively high-income racial and ethnic groups had relatively low rates of food insecurity, and vice versa. But the authors also discovered that despite controlling for income, racial disparities in food insecurity rates persisted – raising questions about the meaning of food insecurity from the outset.
For starters, it is important to understand how the USDA and Census Bureau measure food insecurity. Every month, the Census Bureau administers a survey to a representative group of American households—the results of which are used to calculate the unemployment rate, income changes over time, and much more. As part of this survey, once per year the Census Bureau also asks households a series of 18 questions about household members’ experiences of food-related hardships. If the household notes that they have experienced a certain number of hardships, then that household is classified as food insecure.
It should come as no surprise that economically disadvantaged groups—such as American Indian, black and Hispanic Americans—reported substantially higher food insecurity rates than other racial and ethnic groups. For example, only 5.4 percent of Asian households were classified as food insecure, compared to 23.3 percent of American Indian/Alaska Native (AIAN) and 21 percent of black households.
However, these racial disparities persisted even when comparing those within the same income or education group. For instance, 41.3 percent of black households with incomes below the federal poverty line (FPL) were food insecure. But among Asian households below the poverty line, just 18 percent were food insecure. The same was true at the top of the income distribution. Just 2.4 percent of Asian households (and 4 percent of white households) with household incomes greater than 185 percent of the FPL were food insecure, compared to 12.5 percent of AIAN and 11.5 percent of black households with similar incomes.
This pattern held when examining food insecurity rates within educational levels. Asian and white households where the reference person had less than a high school education reported significantly lower rates of food insecurity than AIAN, black, and Hispanic households with the same educational levels. When we examined 2022 data (the most recent year of available data), these within-group disparities were even greater than they were in the USDA’s 2016-2021 report. Figure 1 shows the food insecurity rate by race-ethnicity for those with low and high levels of educational attainment.
Figure 1. Food Insecurity Rate by Race-Ethnicity and Educational Status, 2022
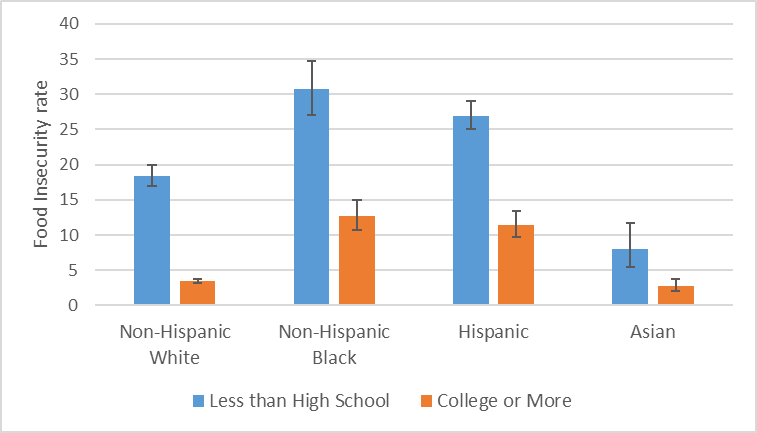
Source: Current Population Survey Food Security Supplement, 2022. Note: Error bars reflect 95% confidence intervals.
These data follow the now-familiar pattern: within each racial-ethnic group, lower education levels correlated with higher food insecurity rates. But the more interesting finding assesses food insecurity rates within education level. For instance, Asian households with less than a high school education had food insecurity rates that were statistically indistinguishable from black and Hispanic individuals with a bachelor’s degree or more. That is, just 8 percent of Asian households with less than a high school education were food insecure, whereas 12.7 and 11.4 percent of black and Hispanic households with college degrees were food insecure.
These results raise the question: if food insecurity is intended to reflect material hardship, why would food insecurity rates vary so greatly between racial and ethnic groups with similar incomes and education levels?
Although the USDA report does not speculate as to why these within-income and within-education level disparities emerge by race, there are at least a few plausible explanations. One of the most likely reasons, as we have previously noted, involves the subjectivity of the food insecurity questions. That is, individuals with similar economic circumstances seem to interpret and respond to certain questions differently.
Some of the questions on the Food Security Supplement capture severe food-related hardships (e.g. “Did you or any of your children not eat for a whole day because there wasn’t enough money for food?”) while others are less severe (“[Could you] afford to eat balanced meals?”). Research has shown that households do not vary in their interpretation of the most severe questions, but vary in their interpretation of less-severe questions. For example, individuals seem to hold varying beliefs about what constitutes a balanced meal, or what it means to worry about food. These discrepancies mean that a household’s food security status may be influenced as much by their interpretation of these conditions as it is by their actual material hardship.
Our own research supports this view. We found that a relatively high share of food insecure households had middle or high incomes, while many low-income households were food secure, suggesting that different interpretations of questions played a role in explaining food insecurity rates. To be sure, this is likely only a part of the reason racial and ethnic disparities in food insecurity among households with similar economic circumstances remain. Nonetheless, these findings add to a growing literature showing that there is something awry with the US’ measure of food insecurity, and that it is not exclusively identifying the most economically disadvantaged households.