The House Agriculture Committee recently failed to pass an appropriations bill that would have authorized a pilot program to test whether nutrition-based restrictions in the Supplemental Nutrition Assistance Program (SNAP) could improve health outcomes for low-income households. This is just the latest rejection by Washington policymakers of proposals designed to improve nutritional outcomes for SNAP participants. Despite opposition to restrictions driven by industry groups and advocates, ensuring that SNAP dollars reinforce nutrition remains one of the most promising policy tools to support the health of low-income households.
But SNAP has not effectively addressed nutrition, with the data pointing to some concerning trends. According to our analysis, SNAP households consume higher levels of unhealthy foods compared to non-SNAP households, specifically sugary beverages.
All households, including those with limited incomes, should have the freedom to make their own choices about food purchases. The government setting reasonable parameters around a taxpayer-funded program such as SNAP does not detract from that ideal. SNAP’s purpose is to supplement food purchasing in low-income households, with the specific aim to improve their nutrition. Excluding foods with no nutritional value from SNAP is consistent with this purpose. SNAP already restricts alcohol and tobacco from purchases, because neither product meets the program’s purpose. Just as with these products, nutrition-based restrictions would not prevent SNAP households from purchasing the foods and beverages they want – it simply requires that households not use government nutritional aid on products with no nutritional value.
Households can only spend their SNAP benefits at grocery stores and other authorized food retailers, making it clear why retailers do not want policymakers to limit the types of foods eligible for SNAP. Others who oppose restrictions cite concerns over government micromanaging household food purchases or the potential for stigmatizing low-income families. These concerns deserve serious consideration, but above all else, SNAP is a nutrition assistance program for low-income households. Until the goals of the program change, supporting nutrition should take priority over the needs of retailers. And when it comes to supporting low-income households’ nutrition, SNAP is not performing well.
A large and growing body of research shows that SNAP contributes to poor health. Although low-income households disproportionately experience health issues such as diet-related disease and obesity, our own research shows that SNAP recipients fare worse than other low-income households on these outcomes. Other research in the Annual Review of Resource Economics suggests SNAP is not helping the situation, finding that SNAP had “little to no effect on nutritional quality.” Much of the reason for nutritional disparities boils down to how SNAP households spend their benefits. A report from the USDA—the agency that administers SNAP—found that SNAP households spend a disproportionate share of their food budget on unhealthy items, such as sugary beverages and prepared desserts.
Most of these studies rely on top-tier data—often originating from grocery stores’ checkout lanes. But there are also some household surveys that can tell us about the foods that SNAP households report typically consuming. The National Health Interview Survey (NHIS), an annual survey conducted by the CDC, asks respondents about their health and wellbeing. Although the NHIS has been conducted since 1957, interviewers have only intermittently asked respondents to discuss their food consumption habits. In 2010, 2015, and 2022, the survey asked households to detail whether, and how frequently, they consume three types of sugary beverages: sodas, sports or energy drinks, and fruit-flavored drinks (such as Kool-Aid or lemonade).
We divided respondents into three groups depending on their poverty and SNAP status: respondents receiving SNAP,[1] low-income households not receiving SNAP,[2] and high-income households not receiving SNAP.[3] In Figure 1, we show the share of each group that reported drinking sugary beverages in the past year for 2022.
Figure 1. Share of adults who report drinking some sugary beverages in the past year, by poverty and SNAP status, 2022.

Source: National Health Interview Survey, 2022
Note: Error bars reflect 95% confidence intervals. Respondents are asked to report 1). how many sugary beverages they drink and 2). how frequently (per day, per week, per month, etc) they consume sugary beverages. If a household reports drinking six or less sugary beverages per year, then they are grouped with those who report never drinking sugary beverages. The percentages above reflect the share of each group that reports drinking more than six sugary beverages per year. Additionally, respondents were instructed to exclude diet sodas from their reported number of sodas.
As Figure 1 shows, two thirds of SNAP adults reported being at least occasional soda-drinkers, compared to 61 percent of low-income non-recipients and just over half of higher-income non-recipients. The same was true for sports drinks and fruit-flavored drinks—SNAP recipients were the most likely to report drinking each with some regularity. Although two-thirds of SNAP recipients reported drinking soda in the past year, that doesn’t tell us how much recipients consumed. Figure 2 shows that the frequency of sugary beverage consumption was also much higher for SNAP recipients compared to non-recipients.
Figure 2. Average number of sugary beverages consumed weekly, by SNAP and poverty status, age 18 and older, 2022
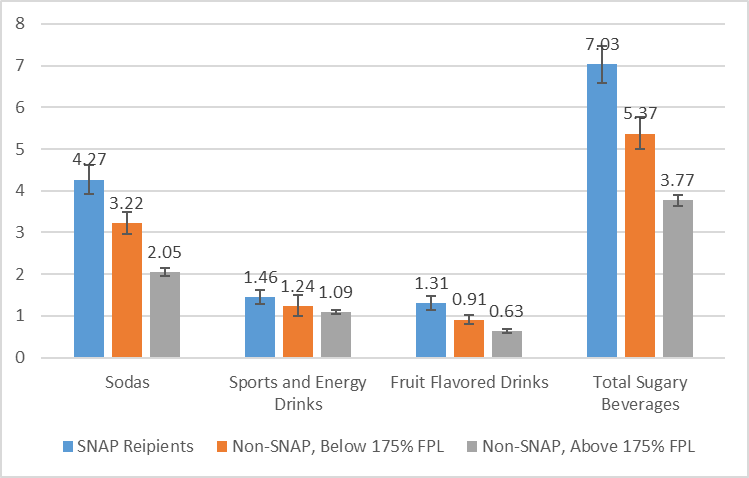
Source: National Health Interview Survey, 2022
Note: Error bars reflect 95% confidence intervals.
On average, SNAP recipients consumed over seven sugary beverages per week, compared to just 5.4 for low-income non-recipients, and 3.8 for higher-income non-recipients. Importantly, these averages also include those who report drinking zero sugary beverages per week. If we restrict our view to those who report drinking sugary beverages at least some of the time, then SNAP recipients reported drinking about 9 sugary beverages per week. It is also worth noting that over half of SNAP recipients’ sugary beverage intake came from soda.
It remains unclear why SNAP recipients have such high sugary beverage consumption compared to non-SNAP recipients. It is possible that households spend SNAP dollars differently than their own money, as research suggests. Alternatively, other research indicates that low-income individuals tend to purchase a higher proportion of their groceries from corner stores and similar retailers that offer unhealthy food options. Whatever the reason, it is clear that SNAP households consume more sugary beverages, on average, than other households do, raising concerns about SNAP’s contribution to poor diet.
Households should be free to choose whatever food and beverages they want. But SNAP is a taxpayer-funded program designed to supplement food purchasing in a way that supports nutrition. By this measure, SNAP performs poorly. Data show that SNAP households have worse health and consume more non-nutritious items, such as sugary beverages, than other households do. Policymakers must ensure that the program stays true to its stated purpose of improving the nutrition of low-income Americans. Like alcohol restrictions, sugary beverage restrictions are consistent with this goal.
[1] Technically this includes all people who live in a household that reported receiving SNAP at any point in the last year.
[2] This includes those living in households with incomes below 175 percent of the federal poverty line, but who have not received SNAP in the past year.
[3] This includes those living in households with incomes above 175 percent of the federal poverty line and who have not received SNAP in the past year.