Social interactions shape social and economic activity across a range of domains, from migration and trade flows to job search and investment behaviors. However, quantifying the effects of social interactions has traditionally been complicated by the absence of large-scale representative data on social networks.
Over the past years, we have worked with deidentified data on social connections from the online social networking site Facebook to overcome some of these measurement challenges. Facebook is unique in its scale and coverage: at the end of the second quarter of 2023, the social network had more than 3 billion active users globally and 270 million active users in the United States and Canada. Combined with the fact that Facebook friendships provide meaningful representations of individuals’ real-life social networks, this data provides researchers with the rare opportunity to measure real-world social networks at population scale and ask: who knows whom, and does this matter?
Using data on the underlying global friendship graph, we have constructed and publicly released a measure of the intensity of friendship links between various geographies.[1] This measure, which we call the Social Connectedness Index, allows us to (i) better understand the determinants of the spatial structure of social networks, and (ii) better understand the effects that these social networks have on a range of economic outcomes.
The Social Connectedness Index
Formally, the Social Connectedness Index (SCI) between two locations i and j—for example, two U.S. counties, or two countries—is given by the following equation:

The interpretation of the SCI is as follows: if the SCI between counties A and B is twice as large as the SCI between counties A and C, then a given Facebook user in county A is twice as likely to be connected with a given Facebook user in county B than a given in county C. The SCI has global coverage and is available at many levels of geographic aggregation, including between U.S. counties, U.S. zip codes, EU counties (NUTS3 regions), and other global subnational regions. Facebook has made the data freely available to any researcher interested in better understanding the determinants and effects of social networks at https://data.humdata.org/dataset/social-connectedness-index.
Patterns across U.S. Counties Using the SCI data, researchers can now explore the geographic structure of social networks. As an example, Figure 1 shows a heatmap of the intensity of friendship links to Milwaukee. Darker colors correspond to stronger social connectedness to Milwaukee. Besides the strong social connections to counties near the city, there are strong social links between Milwaukee and Southern counties around the Mississippi River. These connections capture present-day links caused by the Great Migration, the long-term movement of African Americans from the South to the urban North between 1916 and 1970. The observed patterns highlight the importance of large-scale historical migration movements in shaping the present-day geography of U.S. social networks.
Fig. 1: Strength of Social Connections to Milwaukee County, WI.
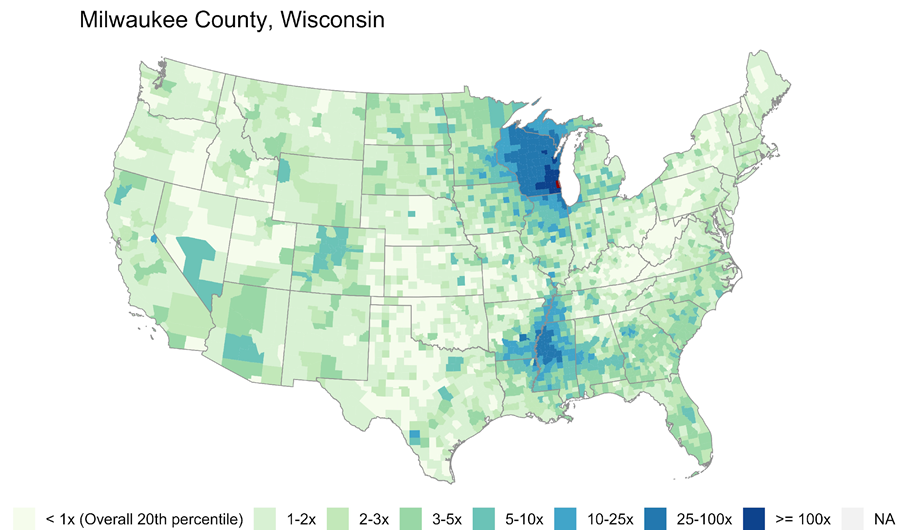
Each category represents different multiples of the 20th percentile of the national distribution of the SCI.
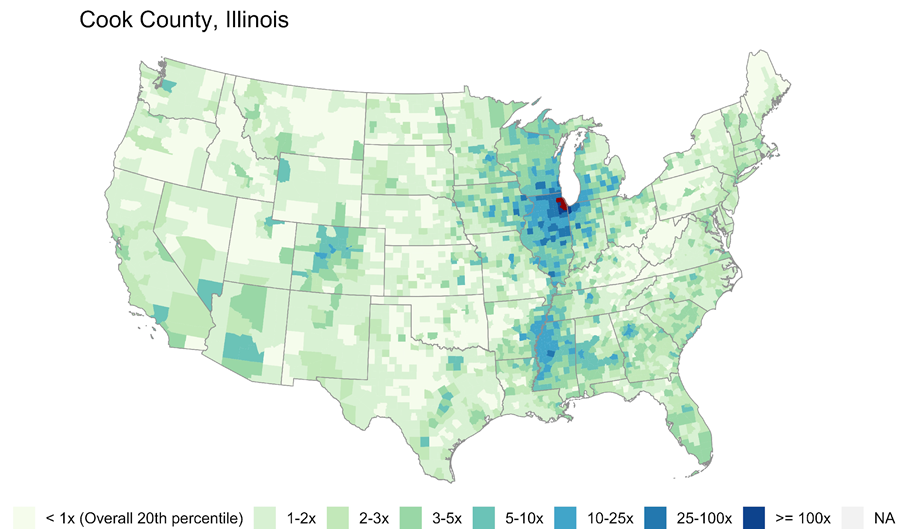
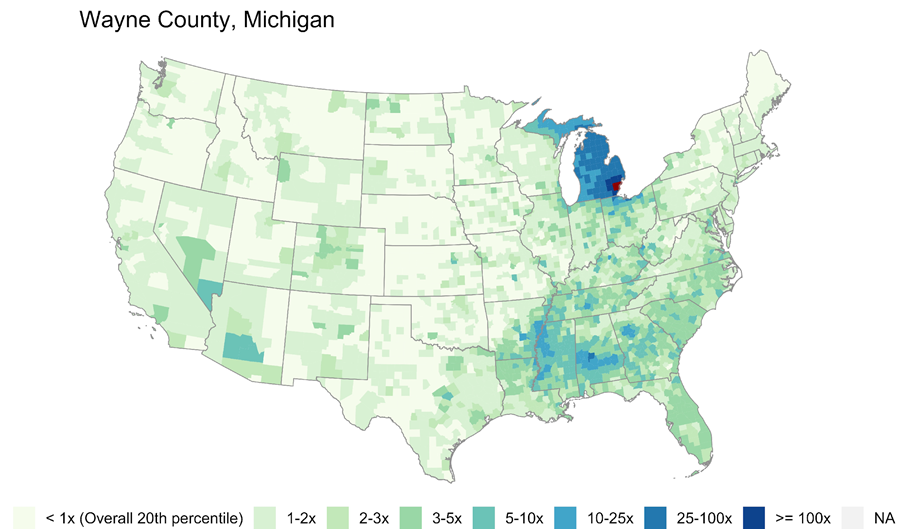
Similar patterns can be seen for other large northern U.S. cities. Figure 2 shows similar maps for the social networks of Cook County, IL (home to Chicago) and Wayne County, MI (home to Detroit). Both of them show a variety of strong links to Southern states.
Fig 2: Strength of Social Connections to Cook County, IL and Wayne County, MI.
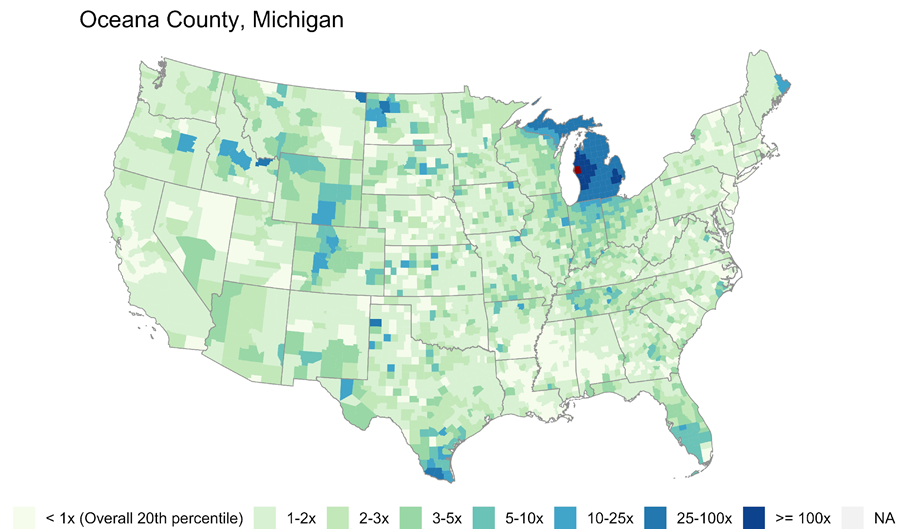
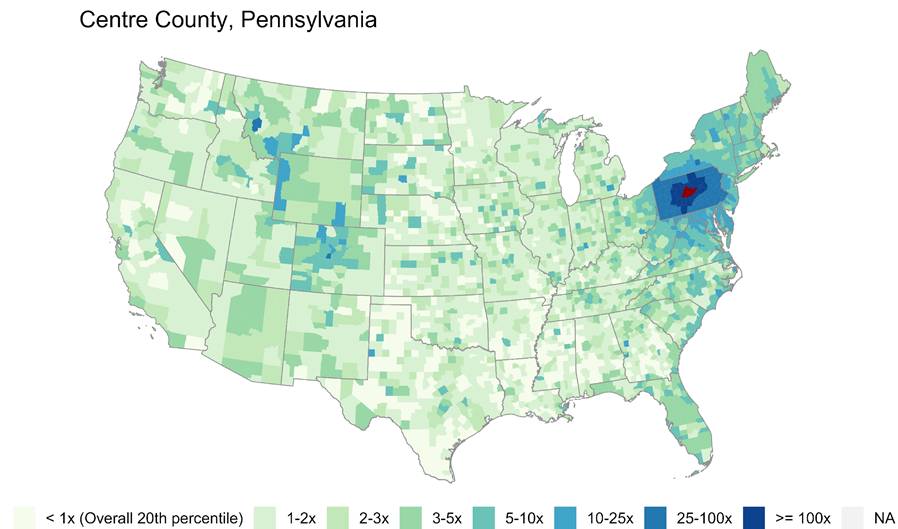
Using the same data, we find that friendship links are substantially stronger within states and fall off strongly at state borders. Figure 3 highlights some county networks exemplifying this pattern. For both Oceana County, MI, and Centre County, PA, the state borders are highly visible.
Fig 3: Strength of Social Connections to Oceana County, MI and Centre County, PA.
The county-level data reveals many other insights. For example, it highlights that counties with similar industry structures are strongly connected; that social networks fall off at natural barriers such as rivers and mountain ranges; and that counties with large military bases and counties with large universities have the social networks with the widest geographic reach.
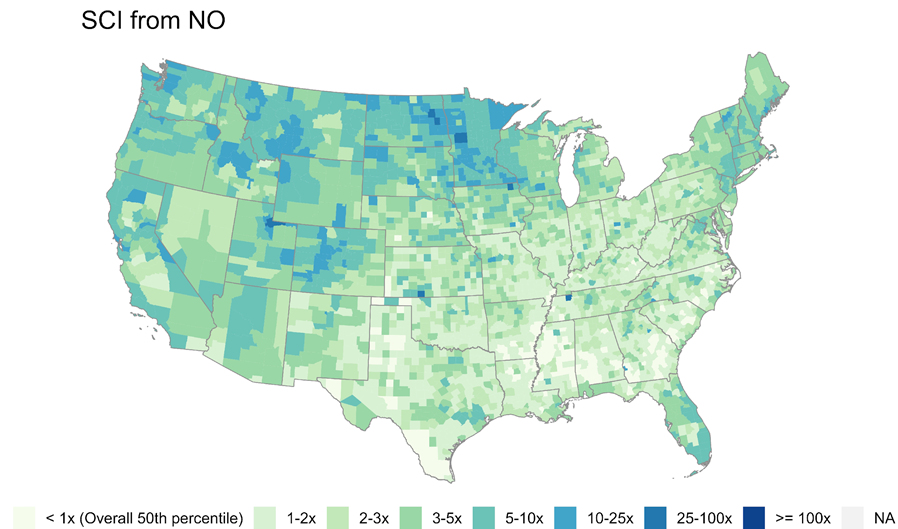
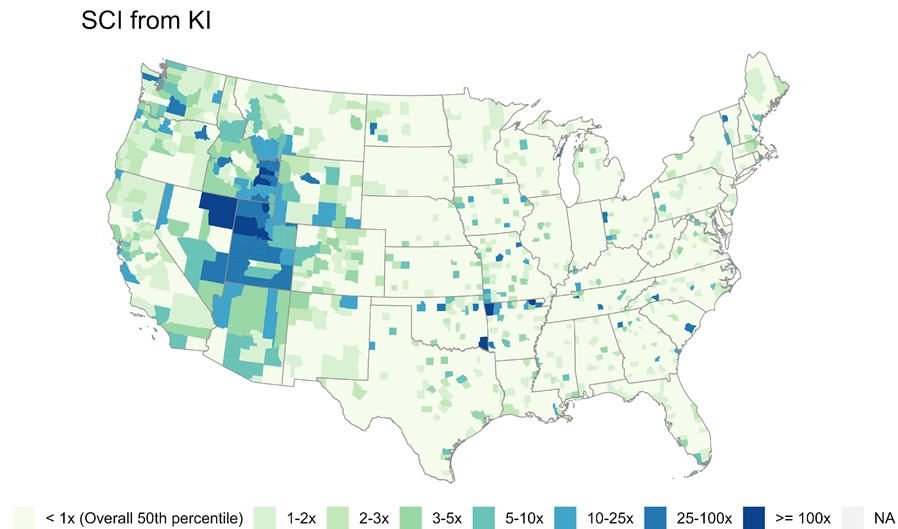
The SCI data also allows researchers to better measure and understand links between U.S. counties and foreign countries. For example, Panel A of Figure 4 shows that there are strong social links between Norway and the states of Minnesota and Wisconsin, which saw large inflows of Norwegian migrants in the late 19th and early 20th centuries. Panel B shows that connections between Kiribati are particularly strong to Utah, a state that sends many Latter-Day-Saint (Mormon) missionaries to the Pacific Island country.
Fig 4: Strength of Social Connections to Norway and Kiribati.
The SCI data is also available at other levels of aggregation. For example, zip code-level data reveals interesting patterns on the structure of social networks within U.S. cities. Specifically, we have used these data to document that importance of transit networks in shaping social links between distant parts of cities.[2] When studying social connections across European regions, we find that locations in different countries that were historically part of the same country continue to exhibit stronger social links than otherwise similar pairs of counties that were not historically part of the same country.[3]
Insights from Research Using the Social Connectedness Index
Beyond allowing researchers to study the determinants of social connectedness, the Social Connectedness Index also allows researchers to study the effects of social connections on a range of economic outcomes. In our studies using this data, we have found that:
- Social connections between locations predict migration flows between these places.[4] For example, during Russia’s invasion of Ukraine, the SCI data has been helpful to estimate where in Europe Ukrainian migrants would settle, based on the strength of friendship networks between Ukrainian and European Regions.[5]
- Social connections facilitate the flow of trade between regions, in large parts by improving the information flow between these locations.[6]
- Mutual fund managers are more likely to invest in firms located in regions to which the fund managers have social ties. The effect is larger for smaller and more opaque firms, suggesting that social ties help raise investors’ awareness of investment opportunities. These effects are large enough that firms in regions with more social links to places with many money managers—places with higher “social proximity to capital”—have higher valuations and higher liquidity. [7]
- Social connections between regions help improve our forecasting of disease transmission, such as during the COVID-19 pandemic, in part because they help us predict which people will more likely interact in person.[8]
- Other researchers have also begun to incorporate this data in their own work, and have documented that (i) individuals are more likely to buy flood insurance when their friends live in places recently affected by floods;[9] (ii) individuals adjust their EITC claiming behavior when their friends are exposed to a newly implemented state EITC;[10] and (iii) that the propensity to abuse opioids is likely to spread through social networks.[11]
Conclusion
Data from online social networking services provides a unique opportunity to measure the structure of real world social networks and variation in measures of social capital across locations.[12] The publicly available Social Connectedness Index is a great example of the power of these data sources, providing rich information that allows researchers to better understand both the determinants and the effects of the spatial structure of social networks. We are excited to see what other insights can be derived from this data, and hope that many of you will join us in a collective research effort to better understand who knows whom, and why this matters!
[1] Bailey, M., Cao, R., Kuchler, T., Stroebel, J., & Wong, A. (2018). Social connectedness: Measurement, determinants, and effects. Journal of Economic Perspectives, 32(3), 259-280.
[2] Bailey, M., Farrell, P., Kuchler, T., & Stroebel, J. (2020). Social connectedness in urban areas. Journal of Urban Economics, 118, 103264.
[3] Bailey, M., Johnston, D., Kuchler, T., Russel, D., State, B., & Stroebel, J. (2020). The determinants of social connectedness in Europe. In Social Informatics: 12th International Conference, SocInfo 2020, Pisa, Italy, October 6–9, 2020, Proceedings 12 (pp. 1-14). Springer International Publishing.
[4] Bailey, M., Cao, R., Kuchler, T., Stroebel, J., & Wong, A. (2018). Social connectedness: Measurement, determinants, and effects. Journal of Economic Perspectives, 32(3), 259-280.
[5] Bailey, M., Johnston, D., Kuchler, T., Russel, D., State, B., & Stroebel, J. (2020). The determinants of social connectedness in Europe. In Social Informatics: 12th International Conference, SocInfo 2020, Pisa, Italy, October 6–9, 2020, Proceedings 12 (pp. 1-14). Springer International Publishing.
[6] Bailey, M., Gupta, A., Hillenbrand, S., Kuchler, T., Richmond, R., & Stroebel, J. (2021). International trade and social connectedness. Journal of International Economics, 129, 103418.
[7] Kuchler, T., Li, Y., Peng, L., Stroebel, J., & Zhou, D. (2022). Social proximity to capital: Implications for investors and firms. The Review of Financial Studies, 35(6), 2743-2789.h
[8] Kuchler, T., Russel, D., & Stroebel, J. (2022). JUE Insight: The geographic spread of COVID-19 correlates with the structure of social networks as measured by Facebook. Journal of Urban Economics, 127, 103314.
[9] Hu, Z. (2022). Social interactions and households’ flood insurance decisions. Journal of Financial Economics, 144(2), 414-432.
[10] Wilson, R. (2022). The impact of social networks on eitc claiming behavior. Review of Economics and Statistics, 104(5), 929-945.
[11] Mäckle, K., & Ruenzi, S. (2022). The Social Transmission of Non-Infectious Diseases: Evidence from the Opioid Epidemic. Available at SSRN 4104796.
[12] Chetty, R., Jackson, M. O., Kuchler, T., Stroebel, J., Hendren, N., Fluegge, R. B., … & Wernerfelt, N. (2022). Social capital I: measurement and associations with economic mobility. Nature, 608(7921), 108-121; Chetty, R., Jackson, M. O., Kuchler, T., Stroebel, J., Hendren, N., Fluegge, R. B., … & Wernerfelt, N. (2022). Social capital II: determinants of economic connectedness. Nature, 608(7921), 122-134.