I recently wrote a brief essay, “Generative AI and Economic Growth,” for Exponential View, the great newsletter by Azeem Azhar. And I knew one particular passage would be sure to raise eyebrows:
A lengthy and fundamentally solid expansion would allow the economic progress of the pre-pandemic period — falling inequality, rising real wages across the income spectrum — to kick back into gear.
See, there’s a group of economic beliefs that I see confidently and repeatedly stated across traditional and social media: inequality is rising, wages are stagnant, upward mobility is dead, and productivity growth is disconnected from pay growth. In short: Capitalism, especially American-style, “cowboy” or “cutthroat” capitalism isn’t working today and hasn’t worked for decades, really.
And while I never try to be contrarian just for the sake of being contrarian, I take a starkly different view on all of those issues. Time for some myth busting, Faster, Please! style!
- “The link between productivity and worker pay is broken.” It isn’t. You might have seen some version of this chart showing a long-term and massive divergence — like, by a factor of five — between productivity growth and wage growth:

But this next chart tells a radically different story about productivity and pay, showing the two stats move together decade after decade with some modest divergence since 2000 — but nothing like disconnect seen in the first chart:

There’s a reasonable argument to be made that the second chart more accurately reflects economic reality in its basic conceptual choices. Among them: Defining output as net output rather than gross output in this case — productivity is output per worker or hour of worker — makes sense since it removes capital depreciation. As AEI economist Michael Strain observes, “Since depreciation is not a source of income, net output is the better measure to use when investigating the link between worker compensation and productivity.
Second, it’s better to include non-wage compensation, including health benefits, rather than just wage compensation given that non-wage compensation has risen as a share of total worker compensation. “Contrary to the current narrative in some policy circles, the link between productivity and wages is strong,” Strain concludes.
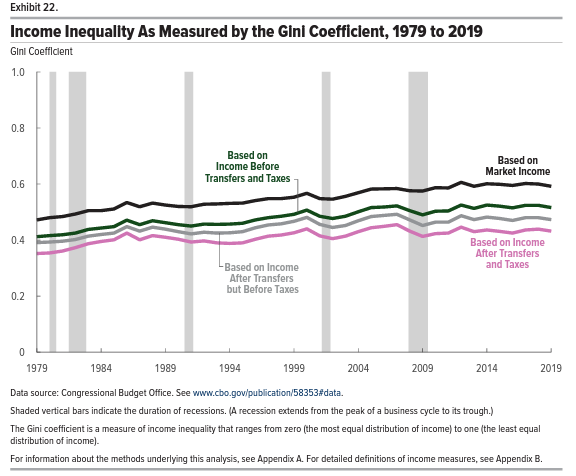
- “Income inequality continues to rise at an alarming rate.” Not at all. As I write in the EV essay, the Congressional Budget Office uses the Gini coefficient to estimate the income gap between higher- and lower-income households. Inequality of income after taxes and transfers — which unlike market income is a comprehensive measure of living standards that considers the impact of taxes and social transfers on people’s economic well-being — increased by 7 percent from 1990 to 2019, but the rise happened only from 1990 to 2007. Inequality has decreased by 5 percent since 2007 when political and media attention to inequality surged in response to the GFC and the Occupy Wall Street protests. Here’s the CBO chart:

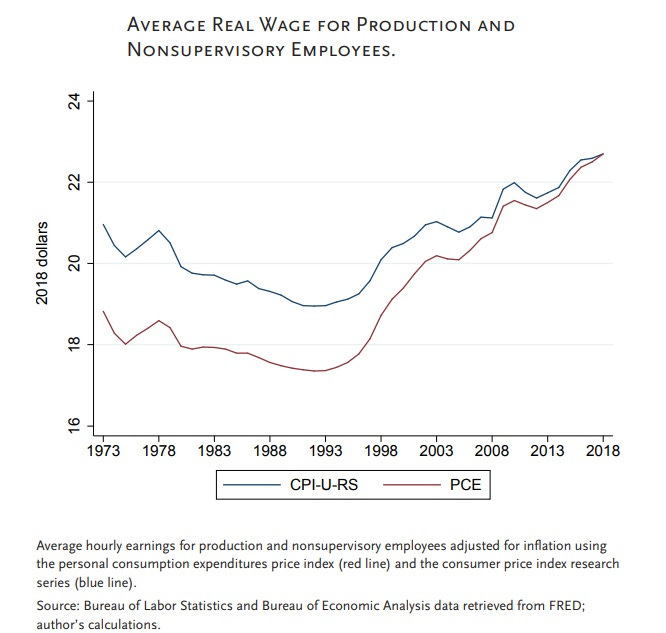
- “Worker wages have gone nowhere for decades.” Think again. The most common version of this claim is that since the 1970s, wages haven’t really gone up much at all — maybe just a teensy 5 percent increase since the Nixon presidency. But using that 5 percent number to sum up five decades of American economic history leads to a misleading claim about stagnation. From the peak of the 1990 business cycle though 2019, real wages have actually gone up by a fifth using the consumer price index and by a third using the price consumption expenditure index, which the Federal Reserve prefers, according to Strain’s calculations.

And if we look at the bigger picture and check how much money people have after taxes and tranfers, the stagnation argument looks even worse. As the CBO noted in its recent look at incomes from 1979 through 2019:
– Over 41 years, all income groups saw highest average income after transfers and taxes in 2019.
– Income growth after transfers and taxes was fastest for top earners, but more even across the distribution due to progressive tax and transfer systems.
– The lowest quintile’s income after transfers and taxes grew 94 percent (1.7% annually).
– The middle three quintiles’ income after transfers and taxes grew 59 percent (1.2 percent annually).
– The highest quintile’s average federal tax rate decreased, resulting in slightly faster growth in income after transfers and taxes (123 percent or 2.0 percent annually), reaching $252,100 in 2019 from $113,100 in 1979.

- “Upward mobility is a thing of the past.” Oh, it’s still happening! Are people doing better in their 40s than their parents were doing during their 40s? Overall, Strain finds that around 73 percent of Americans in their 40s have higher incomes than did their parents. For kids raised in the bottom 20 percent, that number is 86 percent.

Now here’s the thing: While the above data may argue things are better than many Americans and econ pundits think, things could be better still. The whole point of this newsletter is to show a better tomorrow is possible if we make better decisions as a society. And one of those decisions to make sure our entrepreneurial and innovative market economy is firing on all cylinders — and appreciate the value of market capitalism as the best path we know to prosperity.