Each year the USDA issues a closely-followed report on the extent of food insecurity in the United States. This year, the USDA reported 13.5 percent of US households were food insecure at some point in 2023, which was a statistically significant increase from the 2022 rate of 12.8 percent and higher than the pre-pandemic rate of 10.5 percent in 2019. While food insecurity rates rose, very low food security, a more severe version of food insecurity, was unchanged in 2023 compared to 2022, but still 1 percentage point higher than in 2019.
The 2022 increase represented a departure from steady declines in the food insecurity rate following the Great Recession, whereby rates peaked in 2011 at 14.9 percent and then fell 4.7 percentage points (or 31.5 percent) for all US households by 2021. The most recent increase to 13.5 percent of households reporting food insecurity reversed much of these gains. In a March 2024 report, we explored several factors to explain the 2022 rise in food insecurity rates. In order to net out the effects of the COVID-19 pandemic and various economic stimuli, we assessed what factors explain the increase in the food insecurity from pre-pandemic (10.5 percent in 2019) to post-pandemic (12.8 percent in 2022). Our analysis focused on five areas to explain changes to food insecurity: adjustments to safety net programs, changes to the food insecurity measure itself, changes in economic conditions (e.g., unemployment, income, poverty rates, and disability status), changes in food prices/inflation, and changes to the resource gap.
Based on our analysis, we concluded:
“We find that the increase from 2019 to 2022 was likely not due to any cuts to the social safety net nor changes in underlying determinants of food insecurity, such as the unemployment rate. What we do find, however, is that the following can explain these changes: changes in the structure of the survey used to establish the official food insecurity rates, food price inflation, and higher perceptions of the dollars needed to be food secure.”
The increase in food insecurity continued into 2023. In this piece, we explore the same five areas as we did in our March 2024 analysis to draw conclusions about potential drivers of the 2023 increase in the food insecurity rate.
Changes to the Safety Net
Whenever there are increases in the food insecurity rate, gaps in the social safety net are often blamed, followed by calls for expansions in those safety nets. Without a doubt, social safety net programs play a key role in lowering food insecurity rates in the U.S. And in recent years, policymakers have both temporarily and permanently increased benefits for recipients. Of particular note is the permanent increase in SNAP benefits (approximately 21 percent on average) that happened in October 2021 through a reevaluation of the Thrifty Food Plan (TFP; a low-cost food basket used to set the value of SNAP). When combined with adjustments to SNAP benefits to account for inflation, the maximum SNAP benefit increased in nominal terms by an astonishing 46.3 percent from 2019 to 2023. Consistent with this large increase in benefits across the board, from 2019 to 2022 food insecurity rates among SNAP participants fell by 5.3 percent while food insecurity rates increased by 26.9 percent among non-SNAP participants. (This and all subsequent comparisons are our calculations based on data from the Food Security Supplements of the Current Population Survey (CPS),)
In addition to permanent increases in benefits, certain temporary programs—including Emergency Allotments (EAs)—also increased SNAP benefits for recipients. EAs increased SNAP benefits such that all households received the maximum benefit for their household size, irrespective of their income. When the EA program expired in April 2023 (it expired earlier in some states), many of those receiving SNAP would have lost several hundreds of dollars in benefits per month. Although this loss of benefits has been shown to be associated with an increase in food-related hardship, in real terms, SNAP benefits were far higher in April 2023 than they were in the same month prior to the pandemic (April 2019).
Food insecurity rates did increase by 6.3 percent among reported SNAP recipients from 2022 to 2023. (All SNAP recipients are included in this calculation, irrespective of their income levels; other sources, limit analyses to only households with incomes less than 130% of the poverty line.) At least a portion of this increase may be due to the end of the emergency allotment. However, food insecurity rates also increased by 6.1 percent among non-SNAP recipients, i.e., those who did not receive the emergency allotment. Looking at this over a longer time period, the increase in food insecurity rates among SNAP recipients from 2019 to 2023 was 0.6 percent while for non-SNAP recipients it is a much larger, 34.2 percent.
Changes to the Structure of the Questions
Another potential reason for food insecurity rate increases involve changes to the survey. In 2022, there were changes made to the Food Security Supplement CPS—the survey instrument used to estimate food insecurity. Among several changes, the CPS reordered certain questions and altered the structure of the survey. Researchers at USDA found that these changes caused a statistically significant 1-percentage point increase in food insecurity rates, all else equal. There were no further major methodological changes in 2023 and therefore, the annual increase from 2022 to 2023 cannot be attributed to changes in the survey. Nevertheless, changes to the survey have likely caused the food insecurity rate to be elevated compared to earlier years.
Changes in Economic Conditions
In our March 2024 analysis, we analyzed changes from 2019 to 2022 in various economic conditions—such as the poverty rate, the unemployment rate, median income, and homeownership—to assess whether changes in these economic factors appeared to explain the rise in food insecurity rates. Overall, we found that these factors changed very little from 2019 to 2022, therefore making it unlikely that they contributed to increases in the food insecurity rate. We extended this analysis to changes from 2022 to 2023 and draw a similar conclusion. As taken from the December Food Security Supplement of the CPS, over most dimensions, things improved including a fall in the poverty rate from 11.5 percent to 11.1 percent and an increase in median income from $70,223 to $73,398.
| Table 1: Selected Demographic Characteristics, 2019, 2022, 2023 | |||
| 2019 | 2022 | 2023 | |
| Official Poverty Rate | 10.5 | 11.5 | 11.1 |
| Unemployment Rate | 3.7 | 3.6 | 3.6 |
| Median Income (nominal) | 60,484 | 70,223 | 73,398 |
| Homeownership Rate | 65.2 | 66.1 | 65.7 |
| Percent Disabled | 13.2 | 14.0 | 14.8 |
Changes in Overall and Food Price Inflation
Inflation has been a significant issue for US households since the onset of the COVID-19 pandemic and the resulting set of stimulus packages. The annual inflation rate reached historic levels in 2021 and 2022. Although these annual increases started to slow in 2023, they remained elevated by historic standards, suggesting inflation remained an important factor to consider when trying to understand food insecurity rates for 2023. This can be seen in Figure 2 where we display the change in food insecurity from the previous year (left-hand axis) and food-price inflation (right-hand axis). We further show a dashed line indicating the value of 0 for each axis. As seen there, in every year after 2011 there were falls in the food insecurity rate until 2020. Then, rates increased dramatically in 2022 with a smaller increase in 2023 As seen in this figure, one of the major changes over this time period was the acceleration of inflation in 2022 and 2023 which corresponds to the higher food insecurity rates in those years.
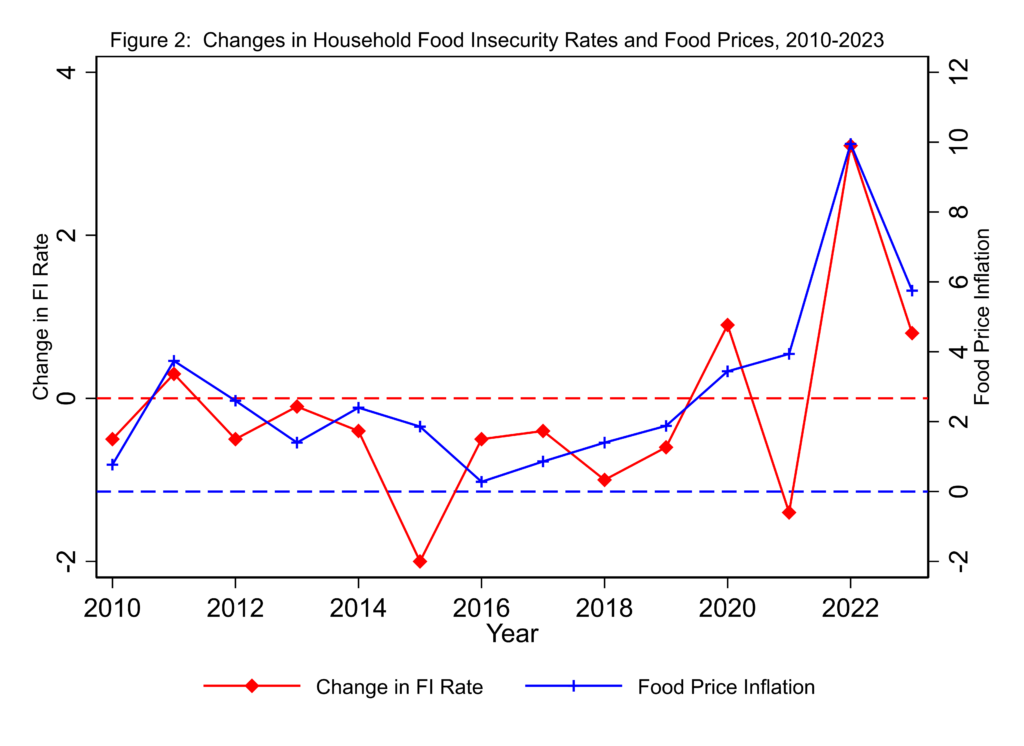
To see how much of the increase in food insecurity is due to inflation, in our March 2024 analysis, we relied on the literature exploring the relationship between price inflation and food insecurity rates. Specifically, we used two studies to estimate the impact of overall and food price inflation on food insecurity rates for 2022 compared to 2019. First, based on data from 2001-2012, Nord et al (2014) found that a one percentage point increase in the overall inflation rate (CPI-U) increased the food insecurity rate by 0.5 percentage points, holding all else equal. When using food price inflation rather than overall inflation, Gregory and Coleman-Jensen (2013) found that a 6.1 percent increase in food price inflation increased the food insecurity rate by 2.7 percentage points.
We again use these methods to estimate the increase in food insecurity due to inflation. Instead of taking the actual inflation rate in any given year (e.g., 2019), we now take the average inflation rate from 2010 to 2021 and consider this the “baseline inflation rate” (1.97 percent). We then consider the impact of inflation in any given year in terms of its relationship to this baseline inflation rate. So, all else equal, food insecurity would rise when inflation exceeds this baseline and fall when inflation is lower than this baseline. For 2022, this means that the food insecurity rate would be 3.0 percentage points [(8.0-1.97)*0.5] greater than 2021 or 13.2 due to inflation alone. This, again, is an overestimate of the actual rate of 12.8 percent in 2022. In 2023, we would expect the relative increase in food insecurity due to inflation would be less since it was 4.1 percent about half of the 8.0 percent inflation rate in 2022. For 2023, we estimate that the food insecurity rate would be 2.1 percentage points higher than in 2022 based on inflation alone [(4.1-1.97)*.5]. This implies a food insecurity rate of 15.1 percent for 2023 based on inflation alone, which is higher than the actual rate of 13.5 percent, implying that inflation could explain the entire increase in food insecurity.
We also consider what happens when we use the Gregory and Coleman-Jensen (2013) approach with food price inflation rather than overall inflation. From 2010 to 2021, the average food price inflation was 2.05 percent, our “baseline food price inflation” value. In 2022, the food price inflation was 9.95 percent, 7.90 percentage points higher than the baseline. This implies that, all else equal, the food insecurity rate would be 3.5 percentage points higher in 2022 than in 2021 [7.9/6.1*2.7] or 13.7 percent which, like when we use the overall inflation rate, was higher than the actual value of 12.8 percent. For 2023, the food price inflation was 5.75 percent. This leads to a predicted increase of 1.6 percentage points to a food insecurity rate of 14.2 percent in 2023 compared to 2022 [3.7/6.1*2.7]. This is lower than the predicted value when we use the overall inflation rate but still higher than the actual rate of 13.5 percent. So, whether we use food price inflation or overall inflation, the entire increase in food insecurity can be ascribed to inflation under these assumptions.
Changes to the Resource Gap
Our earlier paper considered whether changes to the resource gap —that is, the gap between the resources that households report they need and the resources they report they have – may have contributed to the rise in food insecurity from 2019 to 2022. As seen in Figure 3, from 2010 to 2020, this gap was relatively constant, especially in real terms. This changed in 2021 though, when, as expected due to food price inflation, the nominal resource gap did increase. What was a surprise, though, was the large increase in the real resource gap, 21.7 percent over this period. This increase in the nominal gap was smaller in 2023 than 2022 or 2021. The real gap did continue to increase, though, by 2.3 percent.
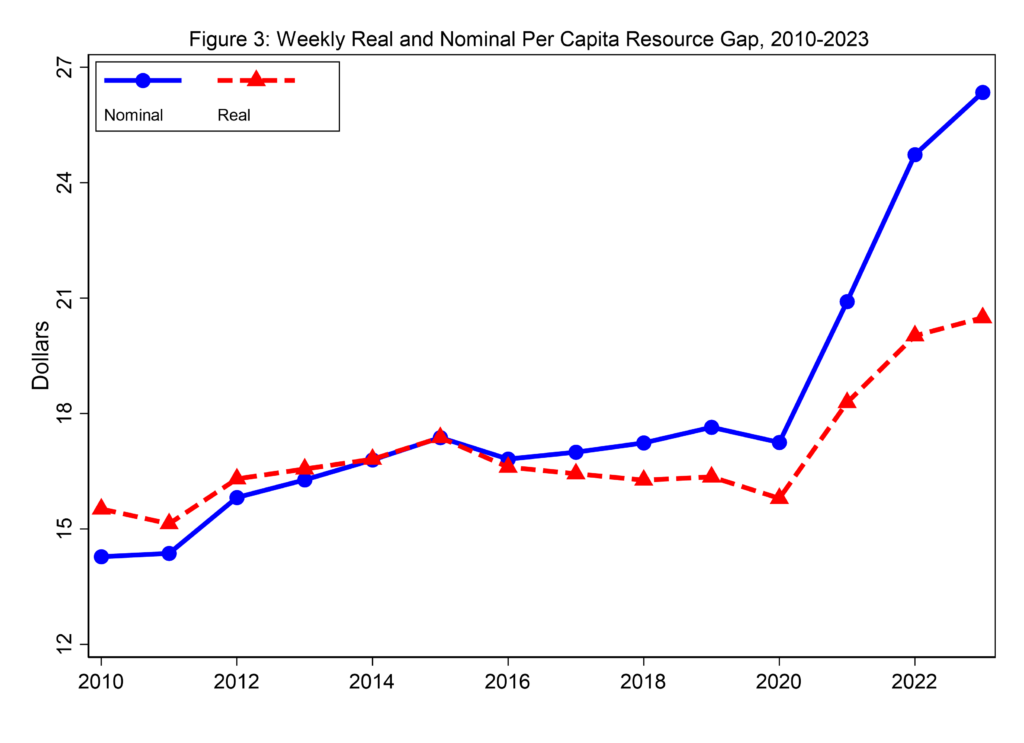
The sharp rise in the real resource gap starting in 2021 and continuing into 2023 demonstrates that food-insecure households reported needing more than the increase in food prices alone to cover their food needs. This may then be responsible for some of the increase in food insecurity, independently of higher food prices.
Conclusion
The food insecurity rate reached 13.5 percent of US households in 2023, representing two years of increases and the highest level since 2011. Policymakers should rightly draw attention to these increases in attempts to understand whether policy levers exist to reverse these trends. Based on our analysis, we conclude that like the increase in food insecurity rates in 2022, annual inflation rates that remained above historic levels are the key factor driving the food insecurity rate increase, especially over the long term. This holds despite inflation, while much higher than recent historical patterns, being lower in 2023 compared to 2022.